
4740
Views & Citations3740
Likes & Shares
Plants are living things that have varied important roles towards mankind. Previously, it was seen simply as a tool for socio-economic use, but nowadays, the various roles they play involve: medicinal role, beautifying role of a good architectural environment etc., and besides all, they protect nature against climate change and equally have a real carbon stock. To emphasize the importance of phyto diversity in the fight against global warming and biodiversity loss, summits are held in various countries with the aim of drafting resolutions against global warming and the loss in biodiversity. There is for example the United Nations Framework Convention on Climate Change [1], itself resulting from the Rio Summit (1992), the Kyoto protocol [2] and also the 2015 Paris Conference on Climate Change [3]. A repeated disorder of the seasonal cycle for a few years now has been observed, in addition to this, the demographic growth caused above all by the humanitarian crisis which has driven populations of Borno (Federal State of Nigeria) and some Cameroonians to flee from the border area following the abuses of boko haram to settle in secure areas such as the case of Minawao camp which currently requires an increase in vital resources for the vulnerable population.
This galloping demography is correlated by the destruction of the plant cover for the benefit of human activities (agriculture, animal husbandry, traditional medicine, and logging, etc.) [4-6].
In order to assess the impact of vegetation exploitation on the carbon stock, we will need to achieve a number of objectives. Firstly, estimate the total biomass of vegetation in the Minawao area and determine its amount of carbon stored in order to assess its credit.
MATERIALS AND METHODS
Presentation of the study area
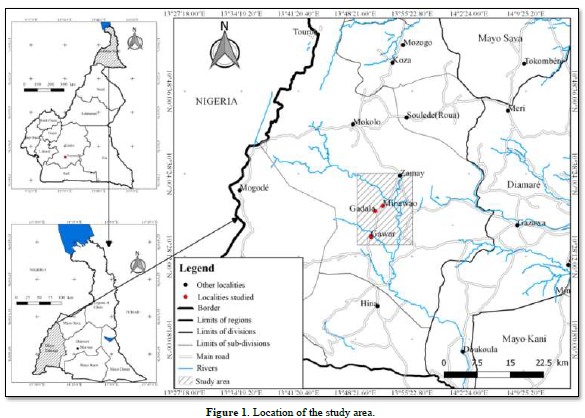
The study took place in Mokolo Sub-division, Mayo-Tsanaga Division, specifically in the Minawao area which includes villages of Minawao, Gadala and Gawar. Mokolo Sub-division covers 1650 km2 and has two first degree chiefdoms, five second degree chiefdoms and 106 third degree chiefdoms. The study area is located between 10 ° 28'- 10 ° 38 ’N latitude and 13 ° 48’- 13 ° 55’ E longitude [7]. It is bounded to the north by the city of Mokolo, to the south by Hina Sub-division, to the east by Gazawa Sub-division, and to the west by Mogode Sub-division (Figure 1).
Methods
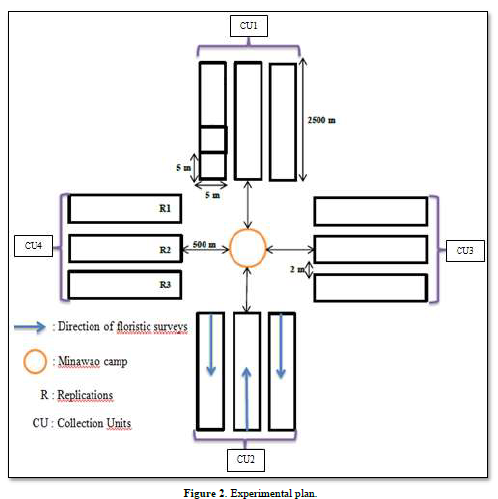
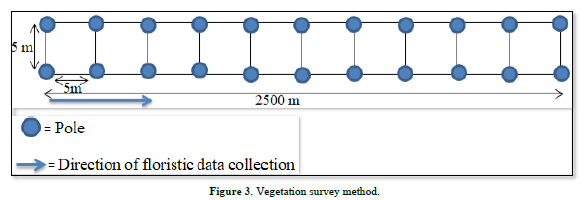
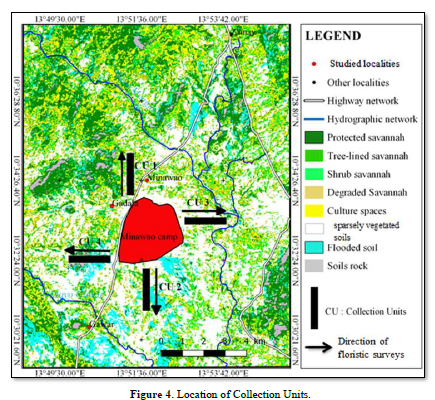
To determine the composition, structure and amount of carbon in the vegetation of Minawao, a floristic inventory was carried out in 3 plots of 5 m x 2500 m separated from each other by 2 m in each of the four plant formations corresponding to CU1, CU2, CU3 and CU4 (Figures 2 & 4), located 500 m from Minawao camp. The total area of each CU is 3.75 ha. The transect method used by Tchobsala [8] was adopted. It makes it possible to achieve and gain precision in the estimation by reducing the displacement efforts. It consists of carrying out stratified sampling by dividing the plot into 500 quadrats of 5 m x 5 m oriented towards the outside of the camp (Figure 3). The plot use is recommended for stands dominated by coppice, the arrangement of inventory plots in clusters is especially recommended in areas where access is difficult [9,10].
On a previously defined collection sheet, all the woody individuals in each of the 500 quadrats were inventoried. The dbh, height and mean diameter of the crown were measured. The dbh and the average crown diameter were measured with a tape measure and the height with a graduated pole. Traces of exploitation (cutting, burning, debarking, pruning, etc.) were noted for all individuals from all plots. Species were identified on site using the determination keys [11,12] or in the laboratory of biodiversity and sustainable development of the University of Ngaoundere. The names of some species have been retained in local languages.
The experimental set-up is a complete randomized block with three repetitions. The block is the treatment and the plots are replications.
Assessment of exploitation impact of plant resources on the carbon stock
Estimation of woody biomass
- Estimation of above-ground biomass
To determine the above-ground biomass, the indirect method was adopted using allometric equations considering the dbh. The equation used by Brown [13] was chosen for this study because the coefficient of determination is highly significant (R2 = 0.987).
This equation has also been developed in the Sahelian climate.
Where AGB is the above-ground biomass of trees (in kg) and dbh is the diameter at breast height of a man.
- Estimation of underground biomass
Root biomass was estimated using an equation described by Cairns [14] who showed that from the total phytomass, the root phytomass (UGB) can be obtained by the following equation:
Where UGB = underground biomass, B = Biomass corresponding to above-ground biomass (AGB).
Estimation of the amount of carbon in woody plants
- Estimation of the amount of carbon
The amount of carbon was calculated from the biomass and the carbon concentration. Under recommendations of IPCC [15] majority of studies use an average value of vegetation carbon concentration of 50 % when more precise data are not available. This quantity of carbon is calculated according to the following formula:
Where AC is the total amount of carbon (tC/ha), B = Biomass (aerial and root) (t/ha) and Cv is the carbon concentration of the vegetation (0.5).
- Carbon credit assessment
The carbon credit was calculated from the quantity of carbon previously estimated and the value of the ecological service according to the following formula: The value of the ecological service is estimated at 10 $/tAC [16]. One USD ($) = 580 FCFA (CoinMill.Com-the currency converter; value of 02/14/2020).
RESULTS
Biomass production
Diameter at breast height of a man (dbh)
Table 1 shows the dbh of the different species. This dbh varies very significantly from one species to another (0.000<0.0001) but not between CU (0.07>0.05). Some species have a very high dbh than others. Regarding the first group there are: Anogeissus leiocarpus (66.32 m/ha), Acacia polyacantha (40.22 m/ha), Faidherbia albida (41.13 m/ha), Tamarindus indica (36.68 m/ha) and Balanites aegyptiaca (34.82 m/ha), while the second group includes among others: Acacia erythrocalyx (0.02 m/ha), Acacia hokki (0.05 m/ha), Combretum paniculatum (0.13 m/ha), Eucalyptus camaldulensis (0.11 m/ha).
Table 1. Variation of dbh between different CU.
|
Species |
CU1 |
CU2 |
CU3 |
CU4 |
Mean±sd |
|
Acacia ataxacantha |
24.09 |
49.77 |
3.93 |
27.3 |
26.27±12.27a |
|
Acacia erythrocalyx |
0.04 |
- |
- |
0.04 |
0.02±002b |
|
Acacia hokki |
0.17 |
- |
- |
0.03 |
0.05±0.06b |
|
Acacia macrostachya |
2.73 |
3.26 |
0.12 |
30.54 |
9.16±10.69c |
|
Acacia nilotica |
6.68 |
9.4 |
0.86 |
37.14 |
13.52±11.81d |
|
Acacia polyacantha |
10.6 |
1.04 |
6.69 |
142.55 |
40.22±51.16e |
|
Acacia seyal |
6.06 |
61.33 |
0.47 |
11.49 |
19.84±20.75g |
|
Acacia sieberiana |
1.4 |
- |
13.84 |
0.07 |
3.83±5.01h |
|
Adansonia digitata |
0.47 |
2.57 |
- |
1.93 |
1.24±1.01i |
|
Adenium obesum |
0.33 |
- |
- |
- |
0.08±0.13b |
|
Agave sisalana |
1.93 |
- |
- |
7.2 |
2.28±2.46j |
|
Annona senegalensis |
5.84 |
36.54 |
4.61 |
0.3 |
11.82±12.36k |
|
Anogeissus leiocarpus |
119.38 |
43.04 |
22.13 |
80.74 |
66.32±33.74l |
|
Azadirachta indica |
13.9 |
10.2 |
1.55 |
15.5 |
10.29±4.41m |
|
Balanites aegyptiaca |
38.88 |
23.04 |
17.93 |
59.45 |
34.82±14.34n |
|
Bauhinia rufescens |
0.06 |
0.48 |
0.04 |
1.03 |
0.40±0.35b |
|
Borassus aethiopum |
13.26 |
0.37 |
15.12 |
- |
7.19±7.00p |
|
Boswellia dalzielii |
1.63 |
- |
0.09 |
- |
0.43±0.60b |
|
Bridelia ferruginea |
- |
- |
0.02 |
- |
0.01±0.01b |
|
Calotropis procera |
- |
20.41 |
2.73 |
1.29 |
6.11±7.15o |
|
Capparis sepiaria |
- |
0.32 |
0.11 |
1.51 |
0.48±0.51b |
|
Cassia siamea |
0.2 |
- |
- |
- |
0.05±0.08b |
|
Cassia singueana |
5.88 |
5.47 |
0.31 |
13.4 |
6.26±3.57o |
|
Celtis integrifolia |
- |
1.54 |
0.7 |
2.9 |
1.29±0.94i |
|
Combretum aculeatum |
0.91 |
6.81 |
3.74 |
1.77 |
3.31±1.97h |
|
Combretum collinum |
14.48 |
3.97 |
1.1 |
6.91 |
6.61±4.08o |
|
Combretum paniculatum |
- |
- |
0.5 |
- |
0.13±0.19b |
|
Combretum tomentosum |
- |
- |
0.81 |
0.03 |
0.21±0.30b |
|
Dalbergia melanoxylon |
0.07 |
0.71 |
0.81 |
1.64 |
0.81±0.42b |
|
Diospyros mespiliformis |
43.63 |
9.71 |
2.62 |
15.68 |
17.91±12.86u |
|
Entada Africana |
- |
- |
0.17 |
- |
0.04±0.06b |
|
Eucalyptus camaldulensis |
- |
0.21 |
0.21 |
- |
0.11±0.11b |
|
Faidherbia albida |
35.91 |
65.69 |
18.57 |
44.34 |
41.13±13.89f |
|
Feretia apodanthera |
2.18 |
0.97 |
1.23 |
4.05 |
2.11±1.01j |
|
Ficus platiphylla |
27.48 |
6.17 |
10.82 |
28.24 |
18.18±9.68q |
|
Ficus sycomorus |
11.5 |
- |
34.89 |
26.41 |
18.20±12.45q |
|
Ficus thonningii |
0.48 |
- |
6.99 |
- |
1.87±2.56i |
|
Gardenia aqualla |
6.06 |
16.21 |
0.5 |
4.47 |
6.81±4.70o |
|
Grewia flavescens |
0.23 |
- |
- |
- |
0.06±0.09b |
|
Haematostaphis barteri |
- |
- |
- |
0.31 |
0.08±0.12b |
|
Ipomoea carnea |
0.23 |
- |
- |
- |
0.06±0.09b |
|
Isoberlina doka |
- |
3.17 |
- |
- |
0.79±1.19b |
|
Jatropha curcas |
- |
0.19 |
0.2 |
0.06 |
0.11±0.08b |
|
Lannea barteri |
6.43 |
7.37 |
1.6 |
0.96 |
4.09±2.81r |
|
Lannea velunita |
0.37 |
- |
- |
- |
0.09±0.14b |
|
Parkia biglobosa |
- |
- |
0.16 |
- |
0.04±0.06b |
|
Piliostigma thonningii |
15.46 |
28.55 |
0.2 |
9.29 |
13.38±8.63s |
|
Sclerocarya birrea |
5.23 |
3.3 |
6.35 |
12,71 |
6.90±2.91o |
|
Steganotenia araliaceae |
- |
- |
0.03 |
- |
0.01±0.01b |
|
Sterculia setigera |
26.78 |
5.13 |
0.68 |
12.31 |
11.22±8.32k |
|
Strychnos spinosa |
- |
0.04 |
- |
- |
0.01±0.02b |
|
Tamarindus indica |
47.16 |
30.74 |
0.81 |
67.99 |
36.68±20.90t |
|
Terminalia glauscesens |
1.87 |
- |
- |
- |
0.47±0.70b |
|
Vernonia thomsoniana |
0.06 |
14.14 |
0.1 |
1.22 |
3.88±5.13h |
|
Vitex doniania |
1.27 |
0.05 |
1.16 |
- |
0.62±0.59b |
|
Ximenia americana |
- |
- |
- |
1.95 |
0.49±0.73b |
|
Ziziphus mauritiana |
4.46 |
26.91 |
0.36 |
9.3 |
10.26±833m |
|
Ziziphus mucronate |
- |
0.6 |
- |
- |
0.15±0.23b |
|
Ziziphus spina-christi |
0.35 |
6.13 |
0.24 |
2.48 |
2.30±2.00j |
|
Mean±sd |
8.58±10.93a |
8.57±10.75a |
3.15±4.22b |
11.64±14.91c |
7.98±2.41p |
sd: standard derivation; Number with the same letter in the same row or column are not statistically different at 5 % level of probability; CU1: wooded savannah; CU2: shrub savannah; CU3: degraded savannah; CU4: wooded savannah
Production of above-ground biomass
Table 2 shows the above-ground biomass of the different species. This biomass varies from one species to another (p<0.0001) but not really between CU (0.23>0.05). Some species have a very high production capacity than others. Regarding the first group there are: Anogeissus leiocarpus (3393.74 t/ha), Acacia polyacantha (3386.10 t/ha), Faidherbia albida (951.70 t/ha), Acacia seyal (488.99 t/ha) and Acacia ataxacantha (422 t/ha) while the second group includes among others: Adansonia digitata (0.62 t/ha), Adenium obesum (0.01 t/ha), Bauhinia rufescens (0.04 t/ha), Capparis sepiaria (0.12 t/ha).
Table 2. Variation in Above ground Biomass Production (t/ha).
|
Species |
CU1 |
CU2 |
CU3 |
CU4 |
Mean±sd |
|
Acacia ataxacantha |
218.28 |
1175.20 |
3.25 |
291.77 |
422±376.54a |
|
Acacia macrostachya |
1.40 |
2.11 |
- |
378.48 |
95.50±141.49b |
|
Acacia nilotica |
1113 |
24.59 |
0.10 |
595.91 |
157.93±218.99c |
|
Acacia polyacantha |
32.50 |
0.15 |
11.17 |
13500.57 |
3386.10±5057.24d |
|
Acacia seyal |
8.88 |
1907.87 |
0.02 |
39.18 |
488.99±709.44e |
|
Acacia sieberiana |
0.30 |
- |
60.34 |
- |
20.21±26.75f |
|
Adansonia digitata |
0.02 |
1.21 |
- |
0.62 |
0.62±0.40g |
|
Adenium obesum |
0.01 |
0.01 |
0.01 |
0.01 |
0.01±0.00g |
|
Agave sisalana |
0.62 |
- |
- |
13.25 |
6.64±6.31h |
|
Annona senegalensis |
8.15 |
573.81 |
4.71 |
0.01 |
146.67±213.57i |
|
Anogeissus leiocarpus |
8946.01 |
838.94 |
179.27 |
3610.72 |
3393.74±2884.63j |
|
Azadirachta indica |
60.95 |
29.72 |
0.38 |
78.47 |
42.38±27.33k |
|
Balanites aegyptiaca |
662.69 |
196.84 |
110.02 |
1774.93 |
686.12±544.40l |
|
Bauhinia rufescens |
- |
0.02 |
- |
0.15 |
0.04±0.05g |
|
Borassus aethiopum |
54.63 |
0.01 |
74.08 |
- |
42.91±28.60m |
|
Boswellia dalzielii |
0.42 |
- |
- |
- |
0.21±0.21g |
|
Calotropis procera |
- |
148.59 |
1.40 |
0.25 |
50.08±65.67n |
|
Capparis sepiaria |
- |
0.01 |
- |
0.35 |
0.12±0.15g |
|
Cassia singueana |
8.28 |
7.00 |
0.01 |
55.98 |
17.82±19.08o |
|
Celtis integrifolia |
- |
0.37 |
0.06 |
1.65 |
0.69±0.64g |
|
Combretum aculeatum |
0.11 |
11.64 |
2.90 |
0.51 |
3.79±3.93p |
|
Combretum collinum |
67.01 |
3.33 |
0.17 |
12.04 |
20.64±23.19f |
|
Combretum paniculatum |
- |
- |
0.03 |
- |
0.03±0.00g |
|
Combretum tomentosum |
- |
- |
0.08 |
- |
0.04±0.04g |
|
Dalbergia melanoxylon |
- |
0.06 |
0.08 |
0.43 |
0.14±0.14g |
|
Diospyros mespiliformis |
865.86 |
26.52 |
1.27 |
80.60 |
243.56±311.15q |
|
Faidherbia albida |
551.12 |
2237.41 |
119.34 |
898.91 |
951.70±642.86r |
|
Feretia apodanthera |
0.83 |
0.13 |
0.22 |
3.49 |
1.17±1.16s |
|
Ficus platiphylla |
296.26 |
9.26 |
34.08 |
315.61 |
163.80±142.13ù |
|
Ficus sycomorus |
39.26 |
- |
515.48 |
270.18 |
274.97±160.34t |
|
Ficus thonningii |
0.02 |
- |
12.37 |
- |
6.20±6.17h |
|
Gardenia aqualla |
8.88 |
87.07 |
0.03 |
4.38 |
25.09±30.99u |
|
Haematostaphis barteri |
- |
- |
- |
0.01 |
0.01±0.00g |
|
Isoberlina doka |
- |
1.98 |
- |
- |
1.98±0.00s |
|
Lannea barteri |
10.19 |
13.99 |
0.40 |
0.12 |
6.18±5.91h |
|
Lannea velunita |
0.01 |
- |
- |
- |
0.01±0.00g |
|
Piliostigma thonningii |
78.00 |
323.71 |
- |
23.93 |
106.41±108.65v |
|
Sclerocarya birrea |
6.31 |
2.17 |
9.90 |
49.52 |
16.97±16.27w |
|
Sterculia setigera |
279.04 |
6.03 |
0.06 |
45.98 |
82.78±98.13x |
|
Tamarindus indica |
1037.14 |
384.26 |
0.08 |
2423.38 |
961±769.05y |
|
Terminalia glauscesens |
0.58 |
- |
- |
- |
0.58±0.00g |
|
Vernonia thomsoniana |
- |
63.41 |
- |
0.22 |
15.91±23.75z |
|
Vitex doniania |
0.24 |
- |
0.19 |
- |
0.14±0.10g |
|
Ximenia americana |
- |
- |
- |
0.64 |
0.64±0.00g |
|
Ziziphus mauritiana |
4.36 |
282.19 |
0.01 |
23.99 |
77.64±102.28µ |
|
Ziziphus mucronate |
- |
0.04 |
- |
- |
0.04±0.00g |
|
Ziziphus spina-christi |
0.01 |
9.12 |
- |
1.12 |
2.56±3.28β |
|
Mean±sd |
308.36±489.35a |
220.23±313.77b |
25.94±41.41c |
612.43±957.32d |
291.74±168.66γ |
Ba: Above ground biomass; sd: standard derivation; Number with the same letter in the same row or column are not statistically different at 5 % level of probability; CU1: wooded savannah; CU2: shrub savannah; CU3: degraded savannah; CU4: wooded savannah
Production of underground biomass
Underground biomass of different species is shown in Table 3. Among these species, those with a high production capacity of root biomass are: Anogeissus leiocarpus (431.45 t/ha), Acacia polyacantha (389.65 t/ha), Faidherbia albida (143.25 t/ha), Balanites aegyptiaca (106.17 t/ha). On the other hand, those with a low capacity for producing root biomass are the most numerous and in reality, constitute the rest of the forest species. Among them, are: Adenium obesum, Combretum paniculatum, Lannea velunita, with substantially zero biomass value (0.01 t/ha), Adansonia digitata (0.22 t/ha), Agave sisalana (1.81 t/ha). The underground biomass production of the species thus demonstrated is closely linked to the aerial biomass, as shown by Cairns [14]. To this end, the same species known for the high production of aboveground biomass are those known for the high production of underground biomass. This suggests that species with an enormous aerial part (trunk, branches, leaves) actually have well-developed root systems. The underground biomass (UGB) varies very significantly from one species to another (P <0.0001) but not between CUs (P = 0.19> 0.05).
Table 3. Variation in Underground Biomass Production (t/ha) between CUs.
|
Species |
CU1 |
CU2 |
CU3 |
CU4 |
Mean±sd |
|
Acacia ataxacantha |
40.45 |
179.05 |
0.98 |
52.28 |
68.19±55.43a |
|
Acacia macrostachya |
0.47 |
0.67 |
- |
65.79 |
16.73±24.53b |
|
Acacia nilotica |
2.92 |
5.88 |
0.04 |
98.26 |
26.77±35.74c |
|
Acacia polyacantha |
7.52 |
0.06 |
2.93 |
1548.07 |
389.65±579.21d |
|
Acacia seyal |
2.39 |
274.73 |
0.01 |
8.87 |
71.50±101.61e |
|
Acacia sieberiana |
0.12 |
- |
12.99 |
- |
4.37±5.75f |
|
Adansonia digitata |
0.01 |
0.41 |
- |
0.23 |
0.22±0.14g |
|
Adenium obesum |
0.01 |
- |
- |
- |
0.01±0.00g |
|
Agave sisalana |
0.23 |
- |
- |
3.40 |
1.81±1.59h |
|
Annona senegalensis |
2.21 |
95.03 |
1.36 |
0.01 |
24.65±35.19i |
|
Anogeissus leiocarpus |
1076.15 |
132.93 |
33.99 |
482.73 |
431.45±347.99j |
|
Azadirachta indica |
13.10 |
6.95 |
0.15 |
16.38 |
9.14±5.60k |
|
Balanites aegyptiaca |
107.93 |
36.92 |
22.08 |
257.74 |
106.17±76.67w |
|
Bauhinia rufescens |
- |
0.01 |
- |
0.06 |
0.02±0.02g |
|
Borassus aethiopum |
11.90 |
0.01 |
15.57 |
- |
9.16±6.10v |
|
Boswellia dalzielii |
0.16 |
- |
- |
- |
0.08±0.08g |
|
Calotropis procera |
- |
28.80 |
0.47 |
0.10 |
9.79±12.67k |
|
Capparis sepiaria |
- |
0.01 |
- |
0.14 |
0.05±0.06g |
|
Cassia singueana |
2.25 |
1.94 |
0.01 |
12.16 |
4.09±4.03f |
|
Celtis integrifolia |
- |
0.14 |
0.03 |
0.54 |
0.24±0.20g |
|
Combretum aculeatum |
0.05 |
3.04 |
0.89 |
0.19 |
1.04±1.00h |
|
Combretum collinum |
14.25 |
1.00 |
0.07 |
3.13 |
4.61±4.82f |
|
Combretum paniculatum |
- |
- |
0.01 |
- |
0.01±0.00g |
|
Combretum tomentosum |
- |
- |
0.04 |
- |
0.02±0.02g |
|
Dalbergia melanoxylon |
- |
0.03 |
0.04 |
0.16 |
0.06±0.05g |
|
Diospyros mespiliformis |
136.69 |
6.28 |
0.43 |
16.78 |
40.04±48.32l |
|
Faidherbia albida |
91.70 |
316.26 |
23.73 |
141.29 |
143.25±86.51m |
|
Feretia apodanthera |
0.29 |
0.06 |
0.09 |
1.05 |
0.37±0.34g |
|
Ficus platiphylla |
52.99 |
2.48 |
7.84 |
56.04 |
29.84±24.68n |
|
Ficus sycomorus |
8.88 |
- |
86.44 |
48.84 |
48.06±26.12o |
|
Ficus thonningii |
0.01 |
- |
3.20 |
|
1.61±1.59h |
|
Gardenia aqualla |
2.39 |
17.96 |
0.01 |
1.28 |
5.41±6.27p |
|
Haematostaphis barteri |
- |
- |
- |
0.01 |
0.01±0.00g |
|
Isoberlina doka |
- |
0.63 |
- |
- |
0.63±0.00g |
|
Lannea barteri |
2.70 |
3.57 |
0.16 |
0.05 |
1.62±1.51h |
|
Lannea velunita |
0.01 |
- |
- |
- |
0.01±0.00g |
|
Piliostigma thonningii |
16.30 |
57.30 |
- |
5.74 |
19.83±18.73q |
|
Sclerocarya birrea |
177 |
0.69 |
2.63 |
10.91 |
4.00±3.45f |
|
Sterculia setigera |
50.26 |
1.70 |
0.03 |
10.22 |
15.55±17.35r |
|
Tamarindus indica |
160.33 |
66.68 |
0.04 |
339.38 |
141.61±108.25s |
|
Terminalia glauscesens |
0.21 |
- |
- |
- |
0.21±0.00g |
|
Vernonia thomsoniana |
- |
13.57 |
- |
0.09 |
3.42±5.08x |
|
Vitex doniania |
0.10 |
- |
0.08 |
- |
0.06±0.04g |
|
Ximenia Americana |
- |
- |
- |
0.23 |
0.23±0.00g |
|
Ziziphus mauritiana |
1.27 |
50.76 |
0.01 |
5.75 |
14.45±18.16t |
|
Ziziphus mucronata |
- |
0.02 |
- |
- |
0.02±0.00g |
|
Ziziphus spina-christi |
0.01 |
2.45 |
- |
0.38 |
0.71±0.87g |
|
Mean±sd |
42.05±64.27a |
34.42±47.36b |
4.92±7.36c |
79.71±119.46d |
40.27±20.60u |
Bs: Underground biomass; sd: standard derivation; Number with the same letter in the same row or column are not statistically different at 5 % level of probability; CU1: wooded savannah; CU2: shrub savannah; CU3: degraded savannah; CU4: wooded savannah
Total biomass production capacity
Total biomass production varies significantly between CUs (P <0.05) and between species (P <0.0001) (Table 4). Anogeissus leiocarpus stands out from other species by its total biomass production which is equal to 3825.19 t/ha. This species is followed by Tamarindus indica (1102.82 t/ha), Faidherbia albida (1094.94 t/ha), Acacia ataxacantha (490.32 t/ha), Diospyros mespiliformis (283.61 t/ha) and Ficus platiphylla (193.64 t/ha). However, other species have a substantially nil biomass production, namely Acacia sieberiana, Calotropis procera, Adenium obesum and Celtis integrifolia. We can also note Adansonia digitata (0.84 t/ha) and Agave sisalana (8.75 t/ha) to quote.
Table 4. Variation of Total Biomass Production Between CUs (t/ha).
|
Species |
CU1 |
CU2 |
CU3 |
CU4 |
Mean±sd |
|
Acacia ataxacantha |
258.73 |
1354.25 |
4.24 |
344.05 |
490.32±431.97a |
|
Acacia macrostachya |
1.86 |
2.78 |
- |
444.27 |
112.23±166.02b |
|
Acacia nilotica |
14.05 |
30.47 |
0.14 |
694.17 |
184.71±254.73c |
|
Acacia polyacantha |
40.02 |
0.21 |
14.10 |
15048.65 |
3775.74±5636.45d |
|
Acacia seyal |
11.27 |
2182.60 |
0.04 |
48.05 |
560.49±811.06e |
|
Acacia sieberiana |
0.42 |
- |
73.32 |
- |
24.58±32.50f |
|
Adansonia digitata |
0.04 |
1.63 |
- |
0.85 |
0.84±0.53g |
|
Adenium obesum |
0.02 |
- |
- |
- |
0.02±0.00g |
|
Agave sisalana |
0.85 |
- |
- |
16.65 |
8.75±7.90h |
|
Annona senegalensis |
10.37 |
668.84 |
6.07 |
0.01 |
171.32±248.76i |
|
Anogeissus leiocarpus |
10022.16 |
971.87 |
213.26 |
4093.45 |
3825.19±3232.62j |
|
Azadirachta indica |
74.05 |
36.67 |
0.52 |
94.86 |
51.52±32.93k |
|
Balanites aegyptiaca |
770.62 |
233.76 |
132.10 |
2032.67 |
792,29±620.19p |
|
Bauhinia rufescens |
- |
0.04 |
- |
0.21 |
0.06±0.07g |
|
Borassus aethiopum |
66.53 |
0.02 |
89.65 |
- |
52.07±34.70l |
|
Boswellia dalzielii |
0.58 |
- |
- |
- |
0.29±0.29g |
|
Calotropis procera |
- |
177.39 |
1.86 |
0.35 |
59.87±78.35q |
|
Capparis sepiaria |
- |
0.02 |
- |
0.49 |
0.17±0.21g |
|
Cassia siamea |
0.01 |
- |
- |
- |
0.01±0.00g |
|
Cassia singueana |
10.53 |
8.94 |
0.01 |
68.14 |
21.90±23.12m |
|
Celtis integrifolia |
- |
0.51 |
0.09 |
2.18 |
0.93±0.84g |
|
Combretum aculeatum |
0.16 |
14.68 |
3.79 |
0.70 |
4.83±4.92n |
|
Combretum collinum |
81.26 |
4.33 |
0.24 |
15.17 |
25.25±28.00o |
|
Combretum paniculatum |
- |
- |
0.04 |
- |
0.04±0.00g |
|
Combretum tomentosum |
- |
- |
0,12 |
- |
0.06±0.06g |
|
Dalbergia melanoxylon |
- |
0.09 |
0,12 |
0,59 |
0.20±0.20g |
|
Diospyros mespiliformis |
1002.56 |
32.80 |
1,70 |
97,38 |
283.61±359.47r |
|
Eucalyptus camaldulensis |
- |
0.01 |
0,01 |
- |
0.01±0.00g |
|
Faidherbia albida |
642.82 |
2553.68 |
143,07 |
1040,20 |
109.94±729.37s |
|
Feretia apodanthera |
1.12 |
0.18 |
0,31 |
4,53 |
1.54±1.50u |
|
Ficus platiphylla |
349.24 |
11.74 |
41,93 |
371,65 |
193.64±166.81v |
|
Ficus sycomorus |
48.15 |
- |
601,93 |
319,02 |
185.93±185.93w |
|
Ficus thonningii |
0.04 |
- |
15,57 |
- |
7.80±7.77x |
|
Gardenia aqualla |
1127 |
105.02 |
0,04 |
5,66 |
30.50±37.26y |
|
Grewia flavescens |
0.01 |
- |
- |
- |
0.01±0.00g |
|
Haematostaphis barteri |
- |
- |
- |
0,01 |
0.01±0.00g |
|
Ipomoea carnea |
0.01 |
- |
- |
- |
0.01±0.00g |
|
Isoberlina doka |
- |
2.61 |
- |
- |
2.61±0.00z |
|
Lannea barteri |
12.89 |
17.55 |
0,56 |
0,18 |
7.80±7.43Ʊ |
|
Lannea velunita |
0.02 |
- |
- |
- |
0.02±0.00g |
|
Piliostigma thonningii |
94.30 |
381.01 |
0,01 |
29,67 |
126.25±127.38ù |
|
Sclerocarya birrea |
8.08 |
2.86 |
12,53 |
60,43 |
20.97±19.73γ |
|
Sterculia setigera |
329.30 |
7.73 |
0,08 |
56,19 |
98.33±115.49β |
|
Tamarindus indica |
1197.47 |
450.93 |
0,12 |
2762,76 |
1102.82±877.29û |
|
Terminalia glauscesens |
0.80 |
- |
- |
- |
0.80±0.00g |
|
Vernonia thomsoniana |
- |
76.99 |
- |
0,30 |
19.32±28.83ƛ |
|
Vitex doniania |
0.33 |
- |
0,27 |
|
0.20±0.13g |
|
Ximenia americana |
- |
- |
- |
0,87 |
0.87±0.00g |
|
Ziziphus mauritiana |
5.64 |
332.95 |
0,02 |
29,74 |
92.09±120.43µ |
|
Ziziphus mucronate |
- |
0.06 |
- |
- |
0.06±0.00g |
|
Ziziphus spina-christi |
0.02 |
11.57 |
0,01 |
1,50 |
3.27±4.15£ |
|
Mean±sd |
350.41±552,73a |
254.65±361.00b |
30.86±49.06c |
692.14±1075.95d |
332.02±189.26ɣ |
Bt: Total biomass; sd: standard derivation; Number with the same letter in the same row or column are not statistically different at 5 % level of probability; CU1: wooded savannah; CU2: shrub savannah; CU3: degraded savannah; CU4: wooded savannah
Carbon stock estimate
The total amount of carbon stored by all the CUs is estimated on average at 166.01 tC/ha (Table 5). It varies significantly (P = 0.03 <0.05) between CUs and between species. CU4 is the one that has a quantity of carbon (346.07 tC/ha) greater than those of other CUs which do not differ significantly (P> 0.05) from each other (15.43-175.20 tC/ha). The difference between UC4 and other UCs is due to the low logging activity due to the difficult accessibility of UC4 to neighboring populations. In terms of species in general, those that sequestrate the most carbon is: Anogeissus leiocarpus (1912.59 tC/ha), Acacia polyacantha (1887.87 tC/ha) Tamarindus indica (551.41 tC/ha), Faidherbia albida (547.47 tC/ha), Balanites aegyptiaca (396.14 tC/ha), Ficus sycomorus (161.52 tC/ha), and Diospyros mespiliformis (141.80 tC/ha).
Table 5. Variation in the Quantity of Carbon Stored (tC/ha).
|
Species |
CU1 |
CU2 |
CU3 |
CU4 |
Mean±sd |
|
Acacia ataxacantha |
129.37 |
677.12 |
2 .12 |
172.03 |
245.16±215.98a |
|
Acacia macrostachya |
0.93 |
1.39 |
- |
222.14 |
56.11±83.01b |
|
Acacia nilotica |
7.03 |
15.23 |
0.07 |
347.08 |
92.35±127.37c |
|
Acacia polyacantha |
20.01 |
0.11 |
7.05 |
7524.32 |
1887.87±2818.23d |
|
Acacia seyal |
5.64 |
1091.30 |
0.02 |
24.03 |
280.25±405.53e |
|
Acacia sieberiana |
0.21 |
- |
36.66 |
- |
12.29±16.25f |
|
Adansonia digitata |
0.02 |
0.81 |
- |
0.43 |
0.42±0.27g |
|
Adenium obesum |
0.01 |
- |
- |
- |
0.01±0.00g |
|
Agave sisalana |
0.43 |
- |
- |
8.33 |
4.38±3.95e |
|
Annona senegalensis |
5.18 |
334.42 |
3.04 |
0.01 |
85.66±142.38f |
|
Anogeissus leiocarpus |
5011.08 |
485.94 |
106.63 |
2046.73 |
1912.59±1616.31g |
|
Azadirachta indica |
37.02 |
18.34 |
0.26 |
47.43 |
25.76±16.46h |
|
Balanites aegyptiaca |
385.31 |
116.88 |
66.05 |
1016.34 |
396.14±310.10i |
|
Bauhinia rufescens |
- |
0.02 |
- |
0.10 |
0.03±0.04g |
|
Borassus aethiopum |
33.26 |
0.01 |
44.83 |
- |
26.03±17.35j |
|
Boswellia dalzielii |
0.29 |
- |
- |
- |
0.15±0.15g |
|
Calotropis procera |
- |
88.69 |
0.93 |
0.17 |
29.93±39.17k |
|
Capparis sepiaria |
- |
0.01 |
- |
0.25 |
0.08±0.11g |
|
Cassia singueana |
5.26 |
4.47 |
0.01 |
34.07 |
10.95±11.56l |
|
Celtis integrifolia |
- |
0.26 |
0.04 |
1.09 |
0.46±0.42g |
|
Combretum aculeatum |
0.08 |
7.34 |
1.89 |
0.35 |
2.42±2.46m |
|
Combretum collinum |
40.63 |
2.17 |
0.12 |
7.59 |
12.63±14.00n |
|
Combretum paniculatum |
- |
- |
0.02 |
- |
0.02±000g |
|
Combretum tomentosum |
- |
- |
0.06 |
- |
0.03±0.03g |
|
Dalbergia melanoxylon |
- |
0.05 |
0.06 |
0.30 |
0.10±0.10g |
|
Diospyros mespiliformis |
501.28 |
16.40 |
0.85 |
48.69 |
141.80±179.74o |
|
Faidherbia albida |
321.41 |
1276.84 |
71.53 |
520.10 |
547.47±364.68p |
|
Feretia apodanthera |
0.56 |
0.09 |
0.16 |
2.27 |
0.77±0.75g |
|
Ficus platiphylla |
174.62 |
5.87 |
20.96 |
185.82 |
96.82±83.40q |
|
Ficus sycomorus |
24.07 |
- |
300.96 |
159.51 |
161.52±92.96r |
|
Ficus thonningii |
0.02 |
- |
7.79 |
- |
3.90±3.88s |
|
Gardenia aqualla |
5.64 |
52.51 |
0.02 |
2.83 |
15.25±18.63y |
|
Haematostaphis barteri |
- |
- |
- |
0.01 |
0.01±0.00g |
|
Isoberlina doka |
- |
1.30 |
- |
- |
1.30±0.00t |
|
Lannea barteri |
6.44 |
8.78 |
0.28 |
0.09 |
3.90±3.71u |
|
Lannea velunita |
0.01 |
- |
- |
- |
0.01±0.00g |
|
Piliostigma thonningii |
47.15 |
190.51 |
- |
14.83 |
63.12±63.69v |
|
Sclerocarya birrea |
4.04 |
1.43 |
6.26 |
30.21 |
10.49±9.86w |
|
Sterculia setigera |
164.65 |
3.87 |
0.04 |
28.10 |
49.16±57.74x |
|
Tamarindus indica |
598.74 |
225.47 |
0.06 |
1381.38 |
551.41±438.65y |
|
Terminalia glauscesens |
0.40 |
- |
- |
- |
0.40±0.00g |
|
Vernonia thomsoniana |
- |
38.49 |
- |
0.15 |
9.66±14.42w |
|
Vitex doniania |
0.17 |
- |
0.14 |
- |
0.10±0.07g |
|
Ximenia Americana |
- |
- |
- |
0.44 |
0.44±0.00g |
|
Ziziphus mauritiana |
2.82 |
166.48 |
0.01 |
14.87 |
46.04±60.22v |
|
Ziziphus mucronate |
- |
0.03 |
- |
- |
0.03±0.00g |
|
Ziziphus spina-christi |
0.01 |
5.78 |
- |
0.75 |
1.64±2.07t |
|
Mean±sd |
175.20±27636a |
127,33±180.50b |
15,43±24.53c |
346.07±537.98d |
166.01±94.63u |
sd: standard derivation; Numbers with the same letter in the same row or column are not statistically different at 5 % level of probability; UC1: wooded savannah; CU2: shrub savannah; CU3: degraded savannah; CU4: wooded savannah
Carbon credit assessment in the different CUs
The average carbon credit value in all CUs is 1660.08 dollars ($), equivalent to 457328.71 FCFA (Table 6).
Table 6. Carbon Credit of Species According to CU ($).
|
Species |
CU1 |
CU2 |
CU3 |
CU4 |
Mean±sd |
|
Acacia ataxacantha |
1293.66 |
6771.25 |
21.18 |
1720.26 |
2451.59±2159.83a |
|
Acacia macrostachya |
9.31 |
13.89 |
0.01 |
2221.37 |
561.14±830.11b |
|
Acacia nilotica |
70.25 |
152.35 |
0.70 |
3470.84 |
923.53±1276.65c |
|
Acacia polyacantha |
200.08 |
1.07 |
70.49 |
75243.23 |
18878.72±28182.26d |
|
Acacia seyal |
56.35 |
10913.02 |
0.18 |
240.26 |
2802.45±4055.28e |
|
Acacia sieberiana |
2.08 |
- |
366.62 |
- |
122.90±162.48f |
|
Adansonia digitata |
0.18 |
8.13 |
- |
4.27 |
4.19±2.67g |
|
Adenium obesum |
0.08 |
- |
- |
- |
0.08±0.00h |
|
Agave sisalana |
4.27 |
- |
- |
83.25 |
43.76±39.49ð |
|
Annona senegalensis |
51.83 |
3344.22 |
30.37 |
0.07 |
856.62±1243.80i |
|
Anogeissus leiocarpus |
50110.80 |
4859.36 |
1066,32 |
20467.25 |
19125.93±16163.09j |
|
Azadirachta indica |
370.25 |
183.36 |
2.61 |
474.28 |
257.62±164.62k |
|
Balanites aegyptiaca |
3853.10 |
1168.80 |
660.49 |
10163.35 |
3961.44±3100.96ñ |
|
Bauhinia rufescens |
- |
0.19 |
- |
1.04 |
0.31±0.37h |
|
Borassus aethiopum |
332.64 |
0.11 |
448.26 |
- |
260.34±173.49l |
|
Boswellia dalzielii |
2.92 |
- |
- |
- |
1.46±1.46m |
|
Calotropis procera |
- |
886.94 |
9.31 |
1.73 |
299.33±391.74@ |
|
Capparis sepiaria |
- |
0.08 |
0.01 |
2.46 |
0.85±1.07h |
|
Cassia siamea |
0.03 |
- |
- |
- |
0.03±0.00h |
|
Cassia singueana |
52.64 |
44.70 |
0.07 |
340.68 |
109.52±115.58n |
|
Celtis integrifolia |
- |
2.57 |
0.44 |
10.92 |
4.64±4.18o |
|
Combretum aculeatum |
0.79 |
73.39 |
18.94 |
3.51 |
24.16±24.62p |
|
Combretum collinum |
406.29 |
21.67 |
1.21 |
75.85 |
126.25±140.02q |
|
Combretum paniculatum |
- |
- |
0.21 |
- |
0.21±0.00h |
|
Combretum tomentosum |
- |
- |
0.61 |
- |
0.31±0.30h |
|
Dalbergia melanoxylon |
- |
0.45 |
0.61 |
2.96 |
1.01±0.98m |
|
Diospyros mespiliformis |
5012.78 |
163.98 |
8.49 |
486.89 |
1418.04±1797.37r |
|
Entada Africana |
- |
- |
0.02 |
- |
0.02±0.00h |
|
Eucalyptus camaldulensis |
- |
0.03 |
0.03 |
- |
0.03±0.00h |
|
Faidherbia albida |
3214.12 |
12768.39 |
715.35 |
5200.98 |
5474.71±3646.84s |
|
Feretia apodanthera |
5.61 |
0.91 |
1.55 |
22.66 |
7.69±7.49t |
|
Ficus platiphylla |
1746.22 |
58.70 |
209.63 |
1858.24 |
968.20±834.03u |
|
Ficus sycomorus |
240.73 |
- |
3009.63 |
1595.12 |
1615.16±929.65v |
|
Ficus thonningii |
0.19 |
- |
77.85 |
- |
39.02±38.83w |
|
Gardenia aqualla |
56.35 |
525.12 |
0.21 |
28.32 |
152.50±186.31x |
|
Grewia flavescens |
0.04 |
- |
- |
- |
0.04±0.00h |
|
Haematostaphis barteri |
- |
- |
- |
0.07 |
0.07±0.00h |
|
Ipomoea carnea |
0.04 |
- |
- |
- |
0.04±0.00h |
|
Isoberlina doka |
- |
13.04 |
- |
- |
0.13±0.00h |
|
Jatropha curcas |
- |
0.02 |
0.03 |
- |
0.02±0.01h |
|
Lannea barteri |
64.44 |
87.77 |
2.80 |
0.89 |
38.98±37.13y |
|
Lannea velunita |
0.11 |
- |
- |
- |
0.11±0.00h |
|
Parkia biglobosa |
- |
- |
0.02 |
- |
0.02±0.00h |
|
Piliostigma thonningii |
471.50 |
1905.06 |
0.03 |
148.33 |
631.23±636.92z |
|
Sclerocarya birrea |
40.39 |
14.28 |
62.64 |
302.13 |
104.86±98.63Ʊ |
|
Sterculia setigera |
1646.50 |
38.66 |
0.41 |
280.96 |
491.63±577.43ɣ |
|
Tamarindus indica |
5987.36 |
2254.67 |
0.61 |
13813.78 |
5514.11±4386.46£ |
|
Terminalia glauscesens |
3.98 |
- |
- |
- |
3.98±0.00µ |
|
Vernonia thomsoniana |
- |
384.93 |
0.01 |
1.52 |
96.62±144.16ƛ |
|
Vitex doniania |
1.67 |
- |
1.36 |
- |
1.01±0.67m |
|
Ximenia americana |
- |
- |
- |
4.37 |
4.37±0.00β |
|
Ziziphus mauritiana |
28.18 |
1664.77 |
0.10 |
148.70 |
460.44±602.17γ |
|
Ziziphus mucronate |
- |
0.31 |
- |
- |
0.13±0.00h |
|
Ziziphus spina-christi |
0.09 |
57.84 |
0,04 |
7.50 |
16.37±20.73û |
|
Mean±sd |
1752.04±2763.63a |
1273.26±1804.98b |
154.31±245.28c |
3460.70±5379.76d |
1660.08±946.29ø |
Number with the same letter in the same row or column are not statistically different at 5% level of probability; CU1: wooded savannah; CU2: shrub savannah; CU3: degraded savannah; CU4: wooded savannah
It varies very significantly from one species to another (0.000<0.0001) but not significantly between CUs (P=0.23>0.05). Among these CUs, CU4 has a carbon credit value (3460.70 $ ≈ 93026.41CFAF) higher than those of other CUs (154.31-1752.04 $). What shows the preponderant value of CU4 (wooded savannah), it is composition as a blossoming tree, the trunks of the trees that compose it are well developed, while in other CU (wooded savannah, shrub savannah and degraded savannah) the trees there are small in diameter. In addition, the exploitation of natural resources is regular in these CUs, because they are easily accessible to residents.
As for the species, those with the most carbon credit is for example Anogeissus leiocarpus (19125.93 $), Acacia polyacantha (18878.72 $), Acacia ataxacantha (2451.59 $), Ficus platiphylla (968.20 $), Annona senegalensis (856,62 $) and finally Balanites aegyptiaca (396144 $), those with the least carbon credit are among others Adansonia digitata (4.19 $), Cassia siamea (0.03 $) and finally Capparis sepiaria (0.85 $). The value of carbon credit evaluated in this work is higher than that of Kodji [17] who worked in the same area. This difference in value would probably be linked to the surface area of the Collection Units (15 ha) compared to the latter's study sites (12 ha), growth of other plants and human action. There is also the large number of large individuals (circumference) inventoried in this study.
DISCUSSION
Biomass production
What shows the difference in biomass production between individuals would be their density and size such as diameter (Table 1 & Table 4).
Among the CUs, CU4 is the one with the highest above-ground biomass (612.43 t/ha), followed by CU1 (308.36 t/ha), then CU2 (220.23 t/ha) and finally CU3 (25.94 t/ha).
The big difference between CU4 (wooded savannah) and other CUs in terms of biomass would be linked to the abundance of large woody plants compared to other CUs whose woody plants are much more exploited. The above-ground biomass of woody plants in CUs in the study area varies from 25.94 to 612.43 t/ha. In comparison to the values of dry areas such as that of Mozogo-Gokoro National Park. Sandjong [18] estimated an average variation of 19.02 to 35.61 t/ha or even that of West Africa. Valbuena [19] found values between 0.49 and 18.91 t/ha.
Total biomass production capacity based on Collection Units
The significant amount of biomass observed in some species can be explained by their well-developed vegetative part (trunks, roots, leaves, branches). With regard to CUs, CU4 has a higher total biomass production (692.14 t/ha) than that of other CUs (30.86-350.41 t/ha) which do not differ significantly between them. This large total biomass production in UC4 would be linked to the conservation of woody phyto diversity due to low exploitation (Table 4). The other three CUs (CU1, CU2 and CU3) have undergone heavy exploitation, this because of the uneven terrain well accessible to operators compared to CU4 which is not only at altitude but seems less accessible. Ibrahima and Abib Fanta [20] in their work on estimating the carbon stock in the tree and shrub faces of the Sudano-Guinean savannahs of Ngaoundere, Cameroon and Tchobsala [21] on carbon sequestration of anthropized vegetation in Ngaoundere (Adamaoua-Cameroon) showed that the differences between the faces of the savannahs are due to the differences in anthropogenic activities. As Herintsitohaina [22] confirmed in his work on the potential for carbon storage in the plant-soil system of Eucalyptus plantations in the Malagasy highlands.
Carbon stock estimate
The amount of carbon stored by individuals is influenced by their abundance and size. Mbow [23] who studied the challenges and hopes of REDD+ in Africa and Tchobsala [6] worked on the impact of logging and carbon sequestration in the Guinean savannah of Ngaoundere Region of Adamaoua-Cameroon demonstrated that human activities negatively influence the amount of carbon stored in vegetation, so as Herintsitohaina [22] for its part, but the emphasis rather on the taxonic side, i.e. the amount of carbon stored varies with the species. In our study, the two factors could explain the difference in carbon stock between CUs and between species.
Carbon credit assessment in the different CUs
The value of carbon credit evaluated in this work is higher than that of Kodji [17] who worked in the same area. This difference in value would probably be linked to the surface area of the Collection Units (15 ha) compared to the latter's study sites (12 ha) and growth of other plants and human action. There is also the large number of large individuals (circumference) inventoried in this study.
CONCLUSION
This study enabled us to enlighten everyone and raise awareness of the impact of vegetation exploitation of the Minawao zone on carbon stock. 7143 individuals divided into 59 species, 42 genera and 30 families were inventoried in the different CUs. The amount of carbon evaluated between these different CUs varies considerably between them. The quantity of carbon stored by all the Collection Units was estimated at an average of 166.01 tC/ha, or the equivalent of 1660.08 $, corresponding to 457328.71 FCFA. UC4 is the one with a quantity of carbon (346.07 tC/ha) greater than those of other CUs between them (15.43- 175.20 tC/ha), therefore it is the one with a carbon credit value (3460.70 $ ≈ 93026.41 FCFA) higher than those of other CUs (154.31- 1752.04 $). It is very important to protect our environment so as to permit the vegetation sequestrate more carbon.
ACKNOWLEDGMENT
We would like to thank the Lamido of Gawar with his notables who were useful to us for surveys. We cannot forget the willingness of the population to provide us with useful information for our work.
- UNFCCC (1992) United Nations Framework Convention on Climate Change New York, pp: 9.
- UNFCC (1997) Kyoto Protocol to the United Nations Framework Convention on Climate Change.
- Cop21 (2015) Conférence de Paris de 2015 sur les changements climatiques. pp: 5.
- Tchotsoua M, Mapongmetsem PM, Tago M (2000) Urbanisation, crise économique et dynamique de l’environnement en milieu soudanien d’altitude: le cas du plateau de Ngaoundéré. Revue géographique du Cameroun. Société et environment au Cameroun 14(2): 225-249.
- Mbolo T (2013) Characterization and impact of wood logging on plant formations in Ngaoundéré District, Adamawa Region, Cameroon. J Ecol Nat Environ 5(10): 265-277.
- Tchobsala, Mbolo M, Souare K (2014) Impact of wood logging on the phytomass and carbon sequestration in the guinea savanna of Ngaoundéré, Adamaoua Region, Cameroon. Glob Adv Res J Environ Sci Toxicol 3(3): 038-048.
- UNHCR (2018) Profil du camp pp: 4.
- Tchobsala (2011) Impact des coupes de bois sur la végétation naturelle de la zone périurbaine de Ngaoundéré (Adamaoua). [Doctoral dissertation, Université de Yaoundé I, Cameroun.]
- Lanly JP (1981) Manuel d’inventaire forestier, avec références particulières 41 aux forêts tropicales hétérogènes. Études FAO: Forêts 27, FAO, Rome, Italie. pp: 9.
- Schreuder HT, Banyard SG, Brink GE (1987) Comparison of three sampling methods in estimating stand parameters for a tropical forest. Forest Ecol Manag 21(1-2): 119-127.
- Arbonnier, M. Bonnet, Grard P (2008) Ligneux du Sahel. V.1.0 CIRAD.
- Maydell HJV (1990) Arbres et Arbustes du Sahel. Livre version francaise de Jean-Bernad Chappious. pp: 267.
- Brown S, Gilespie AJR, Lugo AE (1997) Biomass estimation methods for tropical forest with application to forest inventory data. For Sci 35(4): 881-902.
- Cairns MA, Brown S, Helmer EH, Baumgardner GA (1997) Root biomass carbon estimates for 1980. ORNL/CDIAC-92, DCP-055, Carbon Dioxide Information FAO Forestry 111: 1-11.
- IPCC (2000) Land use, land-use change and forestry (LULUCF). Watson, R.T. et al. (eds). Cambridge University Press pp: 375.
- Ecosystems Marketplace (2019) State of the voluntary carbon market. Ecosystem Services & Management pp: 25.
- Kodji P (2017) Impacts de l’installation des réfugiés sur la dynamique du couvert végétal du camp de Minawao dans le Département du Mayo-Tsanaga (Extrême Nord-Cameroun): implication pour une gestion durable. Mémoire de Master II, Université de Ngaondéré. pp: 47.
- Sandjong SRC (2018) Etude phytoécologique du ParcNational de Mozogo-Gokoro dans l’extreme-Nord Cameroun: implication pour une gestion durable. [Doctoral dissertation, Université de Maroua].
- Valbuena R, Heiskanen J, Aynekulu E, Pitkänen S, Packalen P (2016) Sensitivity of Above-Ground Biomass Estimates to Heigth-Diameter Modellingin Mixed-Species West Africa Woodlands. PLoS One 11(7): 1-2.
- Ibrahim A, Fanta AC (2008) Estimation du stock de carbone dans les faciès arborées et arbustives des savanes soudano-guinéennes de Ngaoundéré, Cameroun. J Experim Biol 04(01): 1-11.
- Tchobsala, Dongock ND, Nyasiri J, Ibrahima A (2016) Carbone storage of anthropoid’s vegetation on the Ngaoundere escarpment (Adamawa-Cameroon). J Adv Biol 9(2): 1-10.
- Herintsitohaina RR (2009) Potentialités de stockage des carbone dans le système plante-sol des plantations d’Eucalyptus des haute terres Malgaches. [Doctoral dissertation]. pp: 193.
- Mbow C, Skole D, Dieng M, Justice C, Kwesha D, et al. (2012) Challenges and Prospects for REDD+ in Africa: Desk Review Of REDD+ Implementation in Africa. GLP Report No. 3. GLP-IPO, Copenhagen; pp: 145.
-
 Table 1
 -
Table 2
-
Table 3
-
Table 4
-
Table 5
-
Table 6
-
Table 7
-
Table 8
-
Table 9
-
Table 10


QUICK LINKS
- SUBMIT MANUSCRIPT
- RECOMMEND THE JOURNAL
-
SUBSCRIBE FOR ALERTS
RELATED JOURNALS
- International Journal of Medical and Clinical Imaging (ISSN:2573-1084)
- Journal of Allergy Research (ISSN:2642-326X)
- Chemotherapy Research Journal (ISSN:2642-0236)
- Journal of Neurosurgery Imaging and Techniques (ISSN:2473-1943)
- Journal of Oral Health and Dentistry (ISSN: 2638-499X)
- Journal of Infectious Diseases and Research (ISSN: 2688-6537)
- International Journal of Radiography Imaging & Radiation Therapy (ISSN:2642-0392)


