INTRODUCTION
Panonychus ulmi Koch (Acari: Tetranychidae), commonly named European red spider mite, is the major phytophagous mite of various crops in the world [1]. Like other mite pests, P. ulmi feed on the cellular contents of leaves, compromising the canopy’s photosynthetic function and causing premature leaves abscission [2]. Based-chemical management programs assigned to insect and mite pests are a double edged, most spider mites of the family Tetranychidae, including P. ulmi, can quickly develop resistance against frequently used acaricides [3]. Facing limitation of the use of chemical control, the use of natural enemies, especially predatory mites of the family Phytoseiidae, has made an increased great interest. The use of phytoseiids is not recent [4], and this taxon groups more than 2 500 valid species, widely distributed around the world [5].
Biological control of the red spider mite, has been established on many cultures, with different phytoseiid species. The predatory mite, T. setubali Dosse (Acari: Phytoseiidae) is widely distributed in Morocco. It was reported on different crops, in many surrounding countries of the Mediterranean basin [6]. Based-field experiments during three seasons of biological control in Morocco, T. setubali is a valuable biological control agent of P. ulmi on different apple varieties. The main objective of this study is to apprehend the functional response of the predaceous mite, T. setubali to various densities of P. ulmi, whether it is of type I, II, or type III. Although lacking bibliographic information related to the development and feeding style of T. setubali, functional response experiments conducted on increasing densities of P. ulmi, can be helpful to improve P. ulmi management programs through understanding the specific behaviour of this species.
The functional response is one of the most commonly used mathematical models to describe predator-prey interactions [7-9]. It is defined as the relationship between the prey density available and the number of preys attacked by a single predator during a given time interval. In biological control, the decision about which natural enemy to use is strongly based on the results of such an analysis, which leads to draw biological conclusions in combination with independent sources of information [10].
Holling [8] has defined three types of functional responses. In Type I, the number of consumed preys increases linearly to a maximum, then remains constant as increasing prey density. In Type II, the number approaches the asymptote hyperbolically as prey densities increases. Whereas in Type III, the number of preys consumed approaches it as a sigmoid curve. Therefore, a clear distinction between type II and III based on predation is rather difficult [11]. Many previously published results reported that type II is the commonly frequent type among predators, especially, among predaceous mites belonging to the family Phytoseiidae [12,13].
Although several regression-based models describing the predation rate of a biological control agent, have been published, the choice of one model to another constitutes a theoretical debate in terms of a complete analysis of data set [14]. Whenever possible, the functional response investigation remains a crucial method in population ecology, it helps to improve the knowledge of the change in prey- predator system, for a successful biological control. Overall, Modeling of the relationship between prey and its predator, has progressed considerably to more mathematically fitted models, which correct errors related to certain classical aspects of calculation [15].
MATERIAL AND METHODS
Rearing of mites
Panonychus ulmi Koch was collected from apple trees in Oulmes region, Morocco, and reared on green bean plants Phaseolus vulgaris L. (Leguminosae). To obtain the seven densities that have been using in functional response experiments, the oviposition of gravid adult females of mite was taken into account. Prey numbers of 2, 4, 8, 16, 32, 64, and 128 immatures, at the same age, were obtained by transferring 1, 3, 5, 10, 16, 34, and 54 females, respectively, onto the leaf discs. Females were allowed to lay eggs for 24 hours, then were removed. The eggs were followed daily once until hatching and emergence of immature stages, which will be used during experiments as food for predators.
The initial population of T. setubali Dosse was obtained from Riyad-Fruit orchard, located at Tiddas, Morocco. The colony of predator was kept in rearing unit and P. ulmi infected bean leaves were daily added. The rearing unit consists of black plastic tiles, placed on a floating sponge into a plastic dish full water (40×27×17 cm). Borders of the black plastic support were covered with a wet wide band of Kleenex, to prevent mite escape.
Rearing of prey and predator colonies were carried out in the culture chamber at 26 ± 1°C, 65 ± 5 % RH, and 16:8 h (L: D) as photoperiod, for four generations before the beginning of the experiments.
To obtain same age-females, a total of fifty gravid females were individually transferred from the stock colony to bean leaf discs (diameter of 3 cm), which containing P. ulmi immatures as food diet. The females were allowed to lay eggs for 12h and then removed. After hatching, newly emerged larvae of T. setubali were followed until adult stage. Subsequently, males and females were paired onto new bean leaf discs until copulation success, and immediately separated. Homogenous cohorts of gravid females were then obtained for stating functional response tests.
Functional response study
To assess the functional response of T. setubali on P. ulmi immatures, 24 h starved adult females were assigned individually to one of seven prey densities (2, 4, 8, 16, 32, 64 and 128 prey), corresponding to 0.28, 0.56, 1.13, 2.26, 4.52, 9.05 and 18.11 mites/ cm2, respectively. After 24h, the predator females were removed and the number of preys killed was counted.
Because of predatory mites spend more time searching and handling prey, even if confined into a smaller space such as a leaf disc, the model does not detect the initial increase in attacks at the lower prey densities [14]. To overcome this model limitation, our experimental design involved ten replicates for mite densities of 0.28, 0.56, 1.13 mites/ cm2, seven replicates for 2.26, and 4.52 mites/cm2, and five for mite densities of 9.05 and 18.11 mites/cm2. Overall, seven prey density levels were tested for one predator female. Controls (without predators) were set up for each prey density.
Numerical response study
The numerical response is the number of offspring produced by female, fed with a given prey density during a time interval [16]. To quantify the numerical response of T. setubali, the oviposition of females was daily followed. The number of eggs laid by females at seven constant densities of P. ulmi, was recorded every 24 h, for 8 consecutive days.
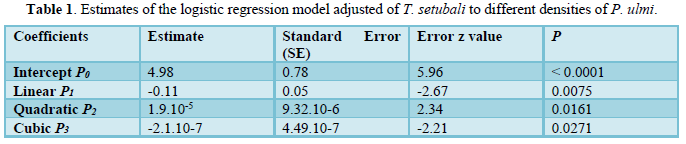
Statistical analysis
Data analysis was performed in R program ver. 3.5.3. [17]. Functional response was determined according to Juliano’s procedure [18]. The logistic regression adjusting a polynomial equation (1) of the proportion of prey attacked (Ne), as a function of the initial prey density (N0), was used to estimate the linear, quadratic and cubic coefficients and therefore, determined the shape of the functional response curve of T. setubali. The type of response was determined by the signs of the linear and quadratic coefficients (P1 and P2). If the linear coefficient is negative (P1 < 0), it describes a type II functional response. If P1 > 0 and P2 < 0, it presents a type III functional response [19].
Where N0 is the initial number of prey, Ne is the number of prey eaten, Ne/ N0 is the probability of being attacked and P0, P1, P2, and P3 are the intercept, linear, quadratic, and cubic coefficients, respectively.
The attack rate (α) and handling time (h) can be determined by using the Holing disc equation or Rogers's random predator equations of type II (2) and type III (3) [20], namely RRPE-II and RRPE-III, respectively.
Rogers’s random predator equations include an attack exponent (q), to describe the per capita prey consumption in low prey densities and overcome the prey depletion at the end of experiments. Even if the number of attacked prey (Ne) appears on both sides of equation (2), the fit of data was performed by using iterative Newton’s method, as an alternative to LambertW function, which allows an explicit solution of the implicit RRPE-II [20]. For the functional response type III, a fitted version (3) of the original model has presented [22]. Both equations make it possible to predict how prey will be depleted over time during functional response experiments.
To describe the numerical response, the relationship between the fecundity of T. setubali females and the prey density available, was fitted by using a hyperbolic model based on this equation:
With (y) is the daily oviposition of females of T. setubali at the prey densities (x), (a) is the maximum daily oviposition, whereas (b) is the number of preys needed to reach half the maximum response.
RESULTS AND DISCUSSION
Functional response
The logistic regression delivered a negative linear coefficient (P1 < 0) for P. ulmi densities, suggesting that T. setubali performed a type II functional response, assuming that the predation rate of adult females of T. setubali increased as prey density increased and levelling off to a maximum of 18 prey (Figure 1a). At the low prey densities ranged from 2 to 16, more than 90 % of P. ulmi immatures was consumed, and as its density increased, the proportion of prey attacked decreased; the rate of consumption tended to stabilize beyond a prey density of 64 mites (Figure 1b).
Estimates of the logistic regression coefficients are given in Table 1. The results revealed that P0, P1, P2, and P3 are significantly different from 0. Further, as the linear coefficient, P1 is negative (P = 0.007) and a positive quadratic coefficient (P = 0.016), T. setubali exhibited a type II functional response. The logistic regression adjusting a polynomial equation of the proportion of prey attacked as function of prey density can be written as:
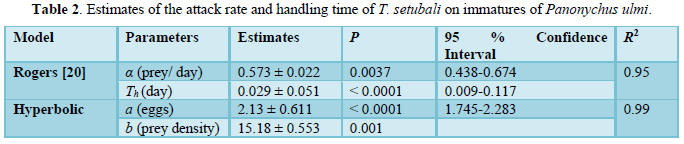
Functional response data of T. setubali were successfully fitted with the Rogers´s model [20]. Both parameters, the attack rate (α) and handling time (Th), were found to be significantly different from 0. The model explained 95 % of the total variation in data (Table 2). The highest predation rate was found by 34.48 prey/ day, and half of the maximum predation was reached at density of 46.24 prey, corresponding to 6.54 prey/ cm2.
The attack rate was 0.573 prey/ day and the handling time was found be Th = 0.029 days/ prey. However, the Th estimated for this species seems to be short, meaning that predators spent less time in capturing, killing, and digesting the prey. These findings were consistent with those obtained for Euseius concordis Chant, reared on Oligonychus ilicis McGregor at 25 °C (0.033 days/ prey) [13]. Similarly, Neoseiulus cucumeris Oudemans had attack rate and handling time on Thrips flavidulus Bagnall, whereas some predatory mites, as Neoseiulus barkeri Hughes and Euseius nicholsi Ehara & Lee, had higher parameters at 26 °C (0.042 prey/ day and 0.057 days/ prey, respectively) [23].
Feeding with P. ulmi, the predatory mites, Euseius finlandicus Oudemans and Amblyseius andersoni Chant, displayed a functional response of type II, when both predators have been exposed to 25°C and increasing P. ulmi densities [24]. Chileseius camposi González y Schuster fed with P. ulmi at 20 ± 2ºC, showed likewise a type II [25]. Moreover, the functional response of a predatory mite, can change from type II to III, and vice versa, when different factors described above intervene over time of experiments.
The functional response of a predatory mite alone, cannot explain the success or failure of a biological control [26]. Several determining factors can affect the behavior of a natural enemy, such as interactions with potential predators [27], properties of host plants [28], as well as abiotic factors, such as temperature [29]. In this study, although the functional response has been studied at restricted conditions of food, functional response parameters of T. setubali could change in presence of pollen during spring, then affects the capacity of predator. For example, the cattail pollen of Typha latifolia L., which reduced significantly the predation rate and search efficiency of Typhlodromus pyri Scheuten, over time when it was tested on P. ulmi [30].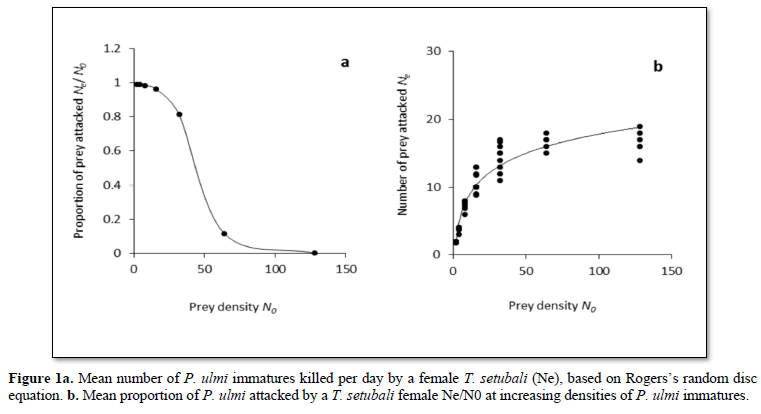
Numerical response
To assess the numerical response of gravid adult females of T. setubali, the hyperbolic model (4) explained 89 % of the total variation in daily oviposition (Table 2). The maximum daily oviposition (m) of predator female was estimated to be 1.86 eggs/ day, while the prey density needed to achieve half the maximum response (n) was estimated to be 2.15 P. ulmi immatures (Figure 2).
The results showed that the oviposition of T. setubali females, increased curvilinearly with prey density until reaching a plateau at prey densities from 32 to 128 P. ulmi immatures, with approximately 2.15 eggs/ female (Figure 2). The prey density-oviposition relationship was positively correlated with the predation rate, because the transformation rate in phytoseiid mites depends strongly on the number of resources invested per egg [31].
Both functional and numerical responses of T. setubali to P. ulmi can be useful for an elementary knowledge, for use as biological control agent. In the case of two or more concurrent predators, the determination of the functional response allows comparing specific effectiveness of each one [32]. Therefore, these results are exempt to field conditions and other mortality factors, like pesticide treatment and potential presence of other natural enemies. Further experiments are needed to evaluate the functional and numerical response of T. setubali, for wide biological control of pest mites on various crops around the Mediterranean.
CONCLUSIONS
This study suggests a type II functional response of T. setubali on P. ulmi immatures, which can be an appropriate food of this species. In addition, gravid females of predator showed a significant oviposition rate at 26 °C.
Although the experimental conditions may not correspond to the situation in field, the present results can be helpful for a first evaluation of the functional response of T. setubali and its incorporating as a biological control agent on various crops.


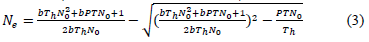
 Table 1


