2502
Views & Citations1502
Likes & Shares
- High: less than 5m BGL
- Medium: 5-15m BGL
- Low: more than 15m BGL
The contamination risks in high table areas are high
Ludhiana city has ample of underground water and therefore, the drinking water supply relies more on tube wells. There are about 80 functional deep tube wells, which are operated round the clock to meet with the drinking water requirements of the people. Apart from municipal sources of water supply, a large number of consumers also have hand pumps for augmenting their water requirement. There are a number of new localities served by shallow hand pumps only. The average per capita consumption of water comes to 25-50 gallons/day. Rapid urbanization and excessive industrialization has led to improper management of water resources and their consequent contamination.
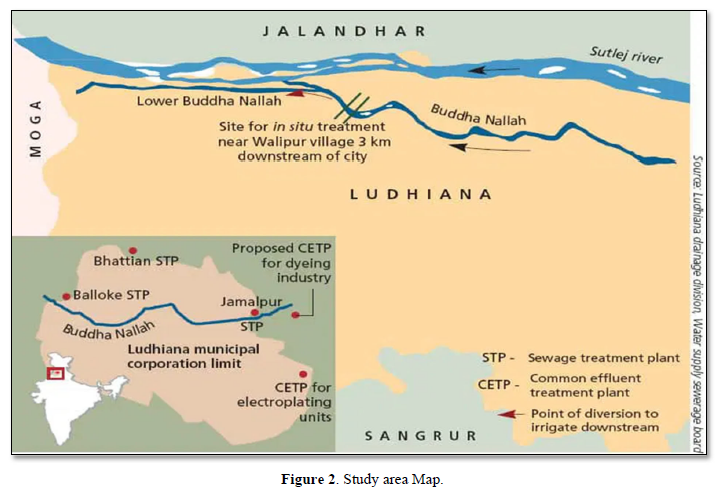
The major water pollution in Ludhiana city arises from the domestic sewage for which there is no satisfactory arrangement of treatment and final disposal (Figure 1). The deterioration in the quality of drinking water is mainly due to the risk to ground water pollution activities viz. disposal of effluents or solid/hazardous waste on land. The sewage from the underground sewerage system is pumped out at many places either into a natural drain flowing through city (Budha nallah) or onto land for irrigation and stagnation (Figure 2). In addition to the domestic waste, sewers carry effluents discharged by the large number of industrial units, which pollute the underground water, bacteriologically and chemically.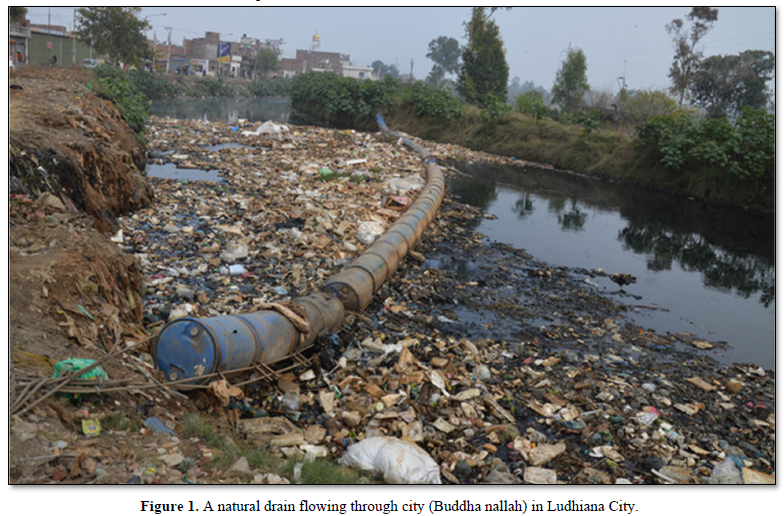
Contamination of the water by domestic and industrial wastes puts consumers at risk of various diseases e.g. gastrointestinal diseases like cholera, typhoid, hepatitis A, parasitic disease caused by different micro-organisms and parasites; damage to the CNS by arsenic; bronchitis, emphysema, anemia and renal stone formation by cadmium; liver necrosis, lung cancer, maxillary sinus cancer by chromium; dental and skeletal fluorosis by excess of fluorides; urolithiasis and cardiovascular diseases like stroke by hardness; lassitude, irritability, anemia, behavioral changes, limb paralysis by lead poisoning and methemoglobinemia, cyanosis and carcinogenic effect by nitrate. Apart from these, excess of sodium, chloride, sulphates, pH, total dissolved solids, zinc and iron render the drinking water unpalatable and objectionable.
Visualizing the extent of problem and associated health risks, it is important to have a broader insight into current status of the situation and also into the economic costs of health damage caused by water borne diseases for intervention purpose.
Land disposal is being increasingly realized as the cheapest and most cost effective method of disposing solid and hazardous waste. Increased industrial activities for the production of finished products have led to use of increasing quantity of raw materials and additives as major inputs. The outputs from these industries include products, by-products, conventionally referred as waste in the form of gaseous emissions, waste-water or solid & hazardous waste. Presence of chemicals, detergents, preservatives, pesticides and other toxic compounds are common in these types of wastes. Disposal of such wastes from industries like electroplating units, tanneries, dyeing, chemical units, textile, heat treatment, pharmaceutical etc. on the land and other important drains i.e. Budha nallah creates potential danger to the environment. Lack of proper disposal system has led to indiscriminate and improper disposal of these wastes affecting health of human beings adversely.
The underground sewage in the past consisted mainly of human excreta and other household waste. With rapid developmental activities the city sewers carry more and more complex waste. In addition to domestic waste, today the sewers carry treated and untreated waste of large number of industries. The degree of treatment of waste varies with type of industry, the small-scale industry discarding the waste most injudiciously. It is also known that even the best treatment methods being used today are unable to eliminate the pollutants. These wastes contain toxic metals like cyanide, chromium and nickel, which accumulate in the body and have a carcinogenic effect.
With the increase in development activities the city now has a number of educational and research institutes like schools, colleges and universities and hospitals. These institutes use various types of chemicals like arsenic, mercury, lead and a number of other more toxic compounds, indiscriminately. These toxic agents are again thrown into the sinks from where these ultimately mix with the city sewers.
The hospitals are responsible for generating solid & hazardous wastes. These also dispose their waste into the city sewers without any treatment. Hospital waste contains many organic and inorganic toxins, radioactive compounds, suspended decomposable organic matter, bacteria, viruses, cysts and ova of pathogens.
Hence, it is now clear that today the city sewage contains not only the nutrients like sodium, phosphate, sulphate, potassium and other micronutrients used for raising agricultural crops but also many toxic compounds like heavy metals, organic compounds, pesticides, radioactive compounds, pathogens, cysts etc. Many of the industries dispose off their waste into the main sewer system, which finally drain into the major drainage stream (Budha Nallah). Agricultural activities near the Budha nallah use this sewage mixed water for irrigation of crops. Consumption of plants and vegetables in these areas pose serious health problems to humans.
Thus, in the wake of the increased industrial, development and human activities it becomes necessary to have details of solid and hazardous waste situation in the city and assessment of health risk associated with exposure to these types of wastes.
The specific objectives of the study are:
- To ascertain the physical, biological and chemical quality of surface and ground water in the study area.
- To ascertain the extent and pattern of air pollution in the study area.
- To assess the status of solid and hazardous waste disposal in the study area.
- To assess the extent and pattern of morbidity and mortality profile in the study area.
- To analyses the relationship between this morbidity/mortality profile and human exposure to environmental pollution.
To ascertain the knowledge, belief, perception and practices of people regarding effect of pollution on human health.
METHODOLOGY
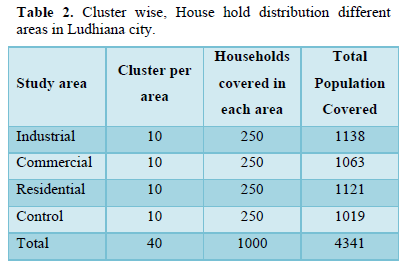
Three areas were randomly selected from the commercial, industrial & residential areas of Ludhiana city & fourth area was selected from a non-industrial area as reference population, i.e. Samrala. A cluster sampling method was used to select the area. In the randomly selected four different areas, initially field investigators did a cross-sectional household survey. By using a semi-structured questionnaire, socio-demographic characteristics important life-style and household information of the individuals residing in the area was collected. Detailed interview of the household members has been done to find their morbidity status (Table 1).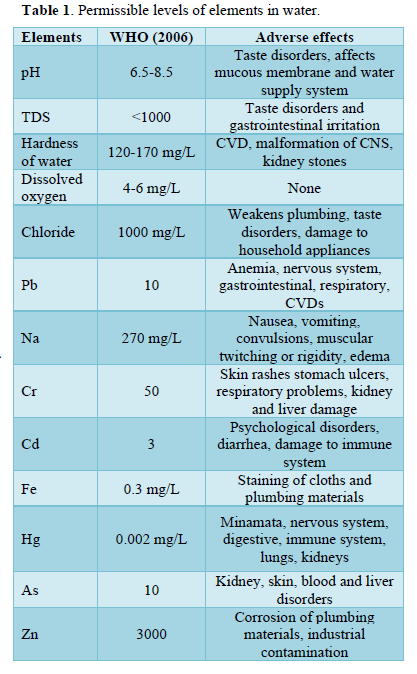
Water pollution
Water samples were collected every month from various sites in commercial, industrial, residential and control areas of Ludhiana City. The water samples will be collected taking all necessary precautions and will be analyzes as per the standard methods prescribed. Water sample from public taps, household storage, hand pumps and tube wells and vegetables, milk and soil samples was also collected. These samples were brought and analyzed in post-harvest center, PAU, Ludhiana to test metal leaves in water and soil and pesticides in milk and vegetable samples. Toxic compounds i.e. arsenic, lead, chromium, cadmium, cyanide, nitrate, hardness, iron, pH, sodium, sulphate, total dissolved solids and zinc were tested in department of community medicine, PGIMER, Chandigarh. Samples were assessed for bacteriological quality (coliform count), in Department of Microbiology, PGIMER, Chandigarh.
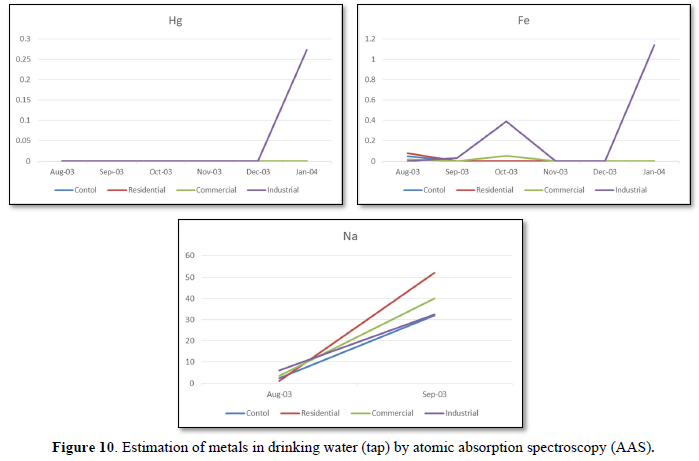
Level of pesticides and metals were monitored in water, milk, soil and vegetable samples from Ludhiana (Exposed area) and Samrala (control area). Presence of pesticides (BHC) ware detected in Bringal samples collected from different sites. Milk samples collected from different sites shows the presence of Pb, Cr, Zn, Fe and Na. Drinking water samples and effluent samples were analyzed for the presence of As, Pb, Cr, Zn, Fe and Na. Apart from that surface soil samples were also analyzed for the presence of B, Ca, Cu, Fe, K, Mg, Mn, P, S, Zn, Al, As, Cd, Co, Cr, Hg, Mo, Na, Ni and Pb.
Detailed interview of the household members has been completed in four areas i.e. Commercial, Industrial and Residential areas of Ludhiana City & Non-Industrial area (Control), i.e. Samrala. Preliminary analysis was done for all these forms. Status of pollution is also summarized.
Detailed list of each cluster in different area is described in Table 2. Data entry for 600 households has been completed. Laboratory work for the project is going on. Sample collection (of air, water, effluent, milk, soil and vegetable) was done from August, 2003 to January, 2004 and the samples are now in the laboratory for testing. Samples of rainy and winter season was collected and analyzed. To see seasonal variation summer samples should also be collected and analyze.
RESULTS
Samples were collected for the three months from October 2003 to December 2003. Analysis of samples were carried out to find the levels of pH, Total Dissolved Solids (TDS), color, odor, total hardness, calcium, magnesium, dissolved oxygen, chloride and coliform count [2-5].
The various physical and chemical parameters of groundwater of residential and industrial areas in Ludhiana City from October 2003 to December 2003 is shown in Table 3.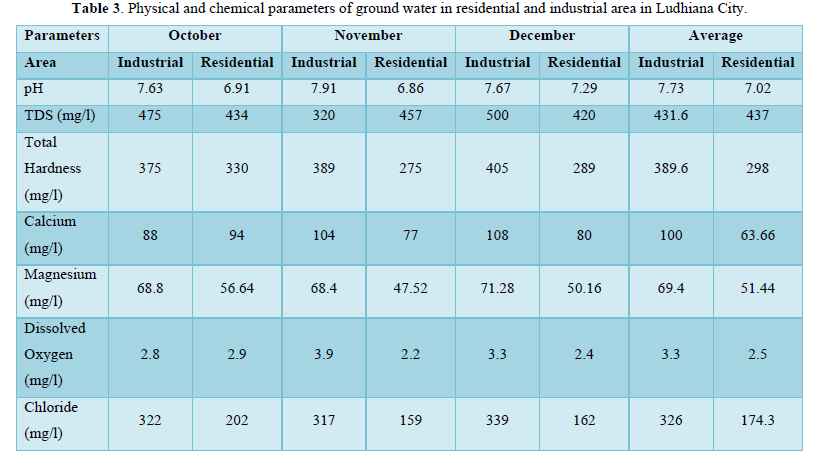
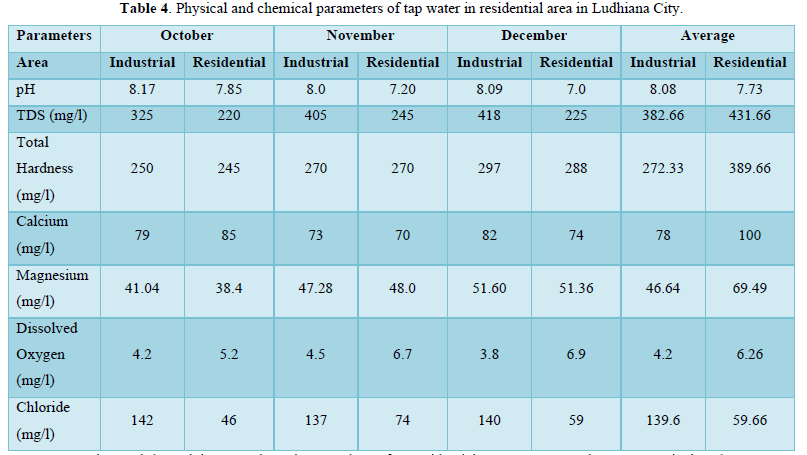
The Table 4 shows the values of various physical and chemical parameters of tap water of residential and industrial areas in Ludhiana City from October 2003 to December 2003.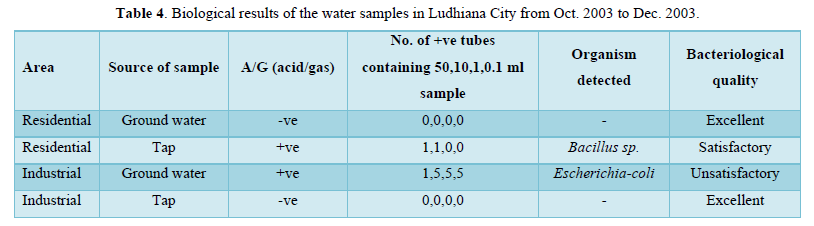
pH: It was observed that minimum and maximum values of pH of tap water in industrial area were 8.0 and 8.17 respectively. The average value of pH of ground water in industrial area was 8.08. Similarly, it was observed that minimum and maximum values of pH of tap water in residential area were 7.0 and 7.85 respectively. The average value of pH of tap water in residential area was 7.73. These results showed that pH value of tap water in industrial and residential areas were within the permissible limit (6.5-8.5) (Figure 3).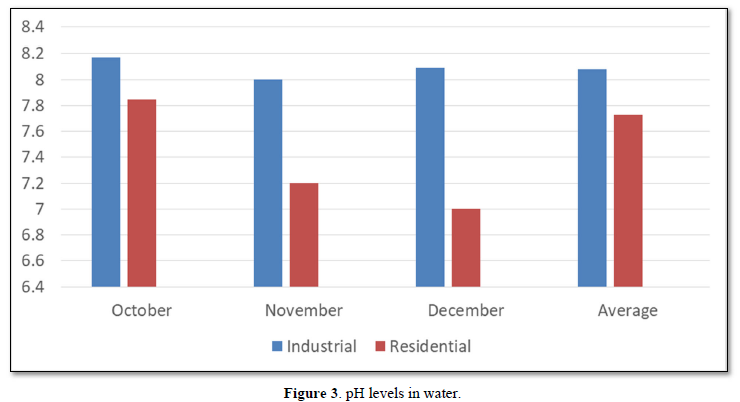
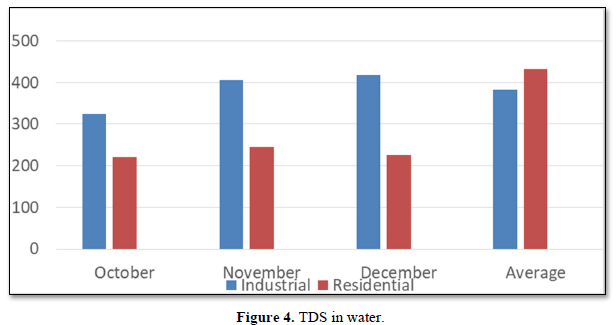
Total dissolved solid: It was observed that minimum and maximum values of total dissolved solids (TDS) of tap water in industrial area were 325 mg/l and 418 mg/l respectively. The average value of total dissolved solids (TDS) of tap water in industrial area was 382.66 mg/l. Similarly; it was observed that minimum and maximum values of total dissolved solids (TDS) of tap water in residential area were 220 mg/l and 245 mg/l respectively. The average value of total dissolved solids (TDS) of tap water in residential area was 431.16 mg/l. These results show that total dissolved solids (TDS) value of tap water in industrial and residential areas were within the permissible limit (250-1000 mg/l) (Figure 4).
Total Hardness: It was observed that minimum and maximum values of total hardness of tap water in industrial area were 250 mg/l and 297 mg/l respectively. The average value of total hardness of tap water in industrial area was 272.33 mg/l. Similarly; it was observed that minimum and maximum values of total hardness of tap water in residential area were 245 mg/l and 288 mg/l respectively. The average value of total hardness of tap water in residential area was 389.66 mg/l. These results show that total hardness value of tap water in industrial area was less than the residential areas. (Permissible limit 300 mg/l) (Figure 5).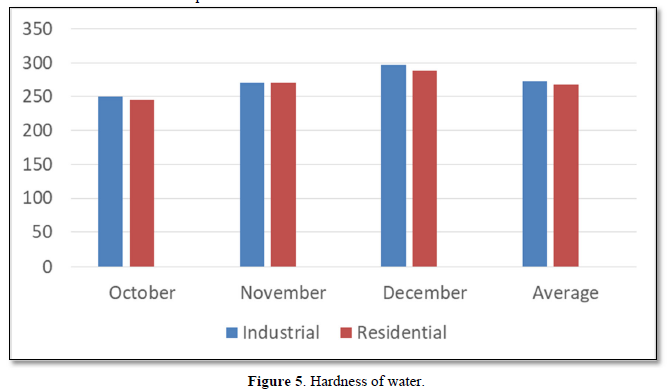
Dissolved Oxygen: The average value of dissolved oxygen of tap water in industrial area was 4.2 mg/l. The average value of dissolved oxygen of tap water in residential area was 6.2 mg/l. These results show that dissolved oxygen value of tap water in industrial and residential areas was within the permissible limit. (>4 mg/l) (Figure 6).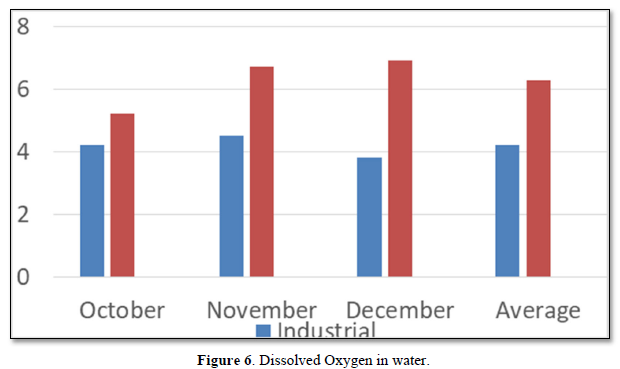
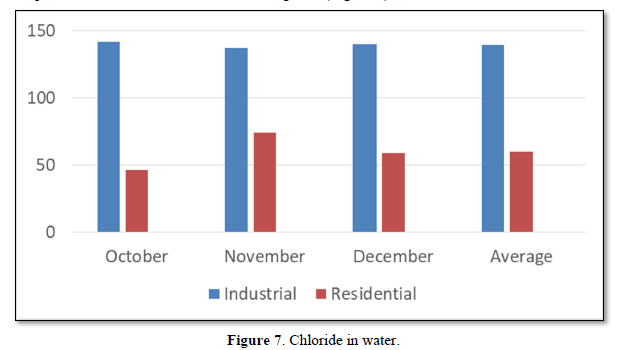
Chloride: Chloride occurs in all natural water in widely varying concentration. Chloride at above 250mg/l concentrations gives salty taste water, which is objectionable to many people. It was observed that minimum and maximum values of chloride of tap water in industrial area were 137mg/l and 142mg/l respectively. The average value of chloride of tap water in industrial area was 139.6mg/l. Similarly; it was observed that minimum and maximum values of chloride of tap water in residential area were 46mg/l and 74mg/l respectively. The average value of chloride of tap water in residential area was 59.6mg/l. These results show that chloride value of tap water of industrial and residential areas were within the permissible limit (Figure 7).
The result shows that one ground water sample from industrial area was found to be positive for E.coli bacteria (Table 4).
Health Status
Socio-economic status was higher of peoples living in the control, commercial and residential area as compared to industrial area according. Low-income settlement was higher in industrial area. Pucca houses were higher as compared to semi-pucca house in all the four areas. Most of the people live in their own houses [8].
Ventilation condition was good in industrial, commercial, residential and control areas. Location of kitchen was indoor in all the house in all the four areas i.e. industrial, commercial, and residential and control area. Kitchen was separated in most of the houses in all the four areas. LPG was used by 79.2% in industrial area, 81.6% in commercial, 78.8% in residential area and 70.4 % in control area. Whereas kerosene was used by 17.6% in industrial area, 19.6% in commercial, 12.0% in residential area and 11.6 % in control area. Wood was used by 1.6% in industrial area, 2.4% in commercial, 8.0% in residential area and 28.0 % in control area. Only 2.8% used other fuels in industrial area.
Vehicular pollution due to heavy and moderate type of vehicles was in Ludhiana whereas Light vehicles were more in Samrala. Width of road is more in Ludhiana as compared to Samrala. More wide roads in residential area as compared commercial and industrial area.
Vehicular piles of heavy-duty trucks and buses were higher in Ludhiana as compared to two wheelers that are more in Samrala. Parked vehicles were higher in control area as compared to Ludhiana. There was no much difference in windows facing towards road, but more windows were opened in Ludhiana as compared to Samrala.
More industries were located at a distance of approx.
Present and previous fumes, vaporous and dust exposure was more in Ludhiana. More workers missed their work due to Illness.
Tap water is used as source of drinking water in residential area (100%) and commercial area (100%). Chlorination method was used in all the four areas. Filter method was more common in residential (22.4%), industrial (14.0%) and commercial areas (27.6%) as compared to control areas (0.8%). Septic tank was used in all the four areas. Garbage disposal facility was more common in residential (85.2%), industrial (81.6%) and commercial areas (62.0%) as compared to control area (45.0%).
Waste water stagnation problem in industrial (50.8%) and commercial area (49.6%) was more as compared to residential (42.0%) and control area (42.0%) whereas rain water stagnation problem was more in industrial (60.0%) and control area (52.4%) as compare to commercial (51.6%) and residential areas (42.0%). More disease vectors were present in control (98.4%) and industrial area (88.4%) as compare to commercial (83.6%) and residential areas (72.8%).
According to perception, industrial air pollution is a major problem in industrial area (96.0%), in commercial (31.2%) and in residential area (27.6%) as compare to control area (0.0%). Vehicular air pollution is also a major problem according to perception, in industrial area (17.6%), in commercial (11.2%) and in residential area (27.6%) as compare to control area (0.0%).
According to perception, ground water pollution is a major problem in industrial area (5.6%), in commercial (50.0%) and in residential area (22.0%) as compare to control area (0.0%). Vehicular noise pollution is also a major problem according to perception, in industrial area (28.4%), in commercial (39.2%) and in residential area (42.4%) as compare to control area (2.1%).
Smokers were more in commercial (15.1%) and residential (12.3%) as compared to industrial (10.1%) and control area (11.2%).
Alcohol habits were more in commercial (14.5%) and industrial (13.1%) as compared to residential (12.0%) and control area (12.4%).
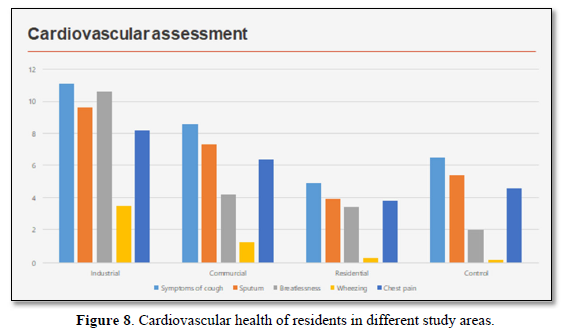
In adults of industrial, commercial and residential areas symptom of cough (11.1%, 8.6%, 4.9% respectively), sputum (9.6%, 7.3%, 3.9% respectively), breathlessness (10.6%, 4.2%, 3.4% respectively) and wheezing (3.5%, 1.3%, 0.3% respectively) were more as compared to control area i.e. cough (6.5%), sputum (5.4%), breathlessness (2.0%) and wheezing (0.2%). There was no difference in hemoptysis cases in these areas [9].
Symptoms of ever had pain in chest were higher, in industrial area (8.2%) and in commercial (6.4%) as compare to in residential area (3.8%) and control area (4.6%). High BP problem were more in industrial area (14.6%), in commercial (17.9%) and in residential area (15.7%) as compare to control area (9.4%). Problem of ever having chest pain was in 8.2% industrial, 6.4% commercial and 3.8% residential areas as compared to 4.6% control areas. Problem of BP was in 14.6% industrial, 17.9% commercial and 15.7% residential areas as compared to 9.4% control areas (Figure 8).
Vector borne diseases i.e. malaria, dengue, were higher in Ludhiana as compared to control area. Eye irritation (21.7%, 22.4%, 12.4% respectively), redness of eyes (16.3%, 11.0%, 6.7% respectively) watery discharge (18.1%, 14.2%, 8.8% respectively) was higher in industrial, commercial and residential areas as compared to control [10-15].
Gastric problem was also higher in Ludhiana as compared to Samrala (Figure 9).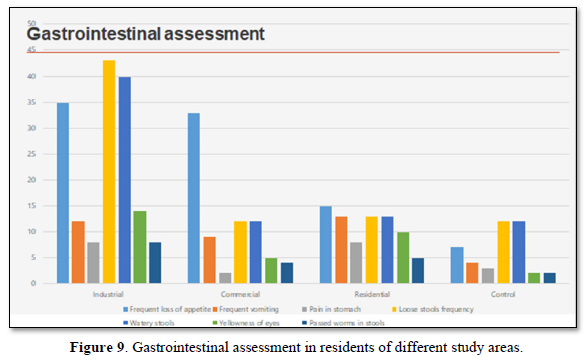
There was not much difference in obstetrical problem in these areas. Kidney problems in industrial area (4.7%), in commercial (4.4%) and in residential area (1.1%) were higher as compare to control area (0.6%).
Illness in last three days, numbers of unable days, doctor visits for this problem were higher in Ludhiana.
Ratings of health status of children’s (
Chest illness before the ages of 2 years were higher in industrial (13.8%), commercial (9.6%) and residential areas (7.0%) as compared to control areas (6.5%) but there were no difference in asthmatic children's in all these four areas [16-20].
Symptoms of cough first thing in the morning were more in industrial (4.5%), commercial (4.5%) and residential area (4.7%) as compared to control area (1.8%). Cough present as much as three month in a year, child cough at other times of the day and cough present as much as three month in a year, were more in industrial (2.8%, 3.4%, 2.3% respectively), commercial (3.2%, 2.7%, 2.7% respectively) and residential area (4.7%, 4.7%, 4.4% respectively) as compared to control area (1.8%, 1.6%, 1.6% respectively). Phlegm with cold and as much as three months in a year was more in industrial (3.1%), commercial (3.7%) and residential area (5.2%) as compared to control area (2.0%) [21-25].
Illness in last three months, number of unable days to do work and doctor visit regarding this problem was more in Ludhiana as compared to Samrala (Figures 10 & 11).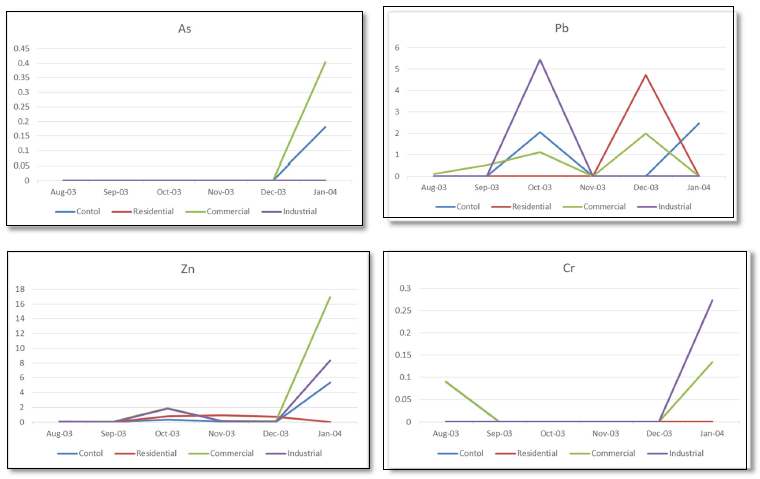
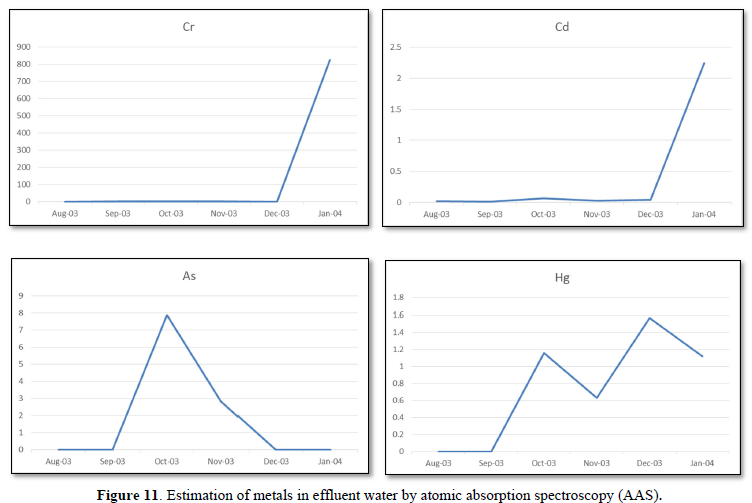
CONCLUSION
It was found that symptoms of cardiovascular and gastrointestinal problems were higher in Ludhiana as compared to control area i.e., Samrala. Illness in last three months, numbers of unable days to do work were also higher in Ludhiana as compared to Samrala. A sudden increase is also seen in all metals (under study) in tap water after the month of December, further studies needed on this topic.
ACKNOWLEDGEMENTS
Not applicable.
CONFLICTS OF INTEREST
The authors have no conflicts of interest to declare.
ETHICAL STATEMENT
The authors are accountable for all aspects of the work in ensuring that questions related to the accuracy or integrity of any part of the work are appropriately investigated and resolved. The study was approved by the Ethics Committee of the Centre for Public Health, Punjab University, and Chandigarh.
- Aggarwal V, Tuli H, Varol A, Thakral F, Yerer M, et al. (2019) Role of reactive oxygen species in cancer progression: Molecular mechanisms and recent advancements. Biomolecules 9(11): 735.
- Thurston GD (1996) A critical review of PM10-mortality time-series studies. J Expo Anal Environ Epidemiol 6: 3-21.
- Goldberg MS, Burnett RT, Steib D (2021) A review of time series studies used to evaluate the short term effects of air pollution on human health. Rev Environ Health 18: 269-303.
- Pope CA 3rd (2000) What do epidemiologic findings tell us about health effects of environmental aerosols? J Aerosol Med 13: 335-354.
- Zemp E, Elsasser S, Schindler C, Künzli N, Perruchoud AP, et al. (1999) Long-term ambient air pollution and respiratory symptoms in adults (SAPSLDIA study). Am J Respir Crit Care Med 159: 1257-1266.
- Wong CM, Hu ZG, Lam TH, Hedley AJ, Peters J (1999) Effects of ambient air pollution and environmental tobacco smoke on respiratory health of non-smoking women in Hong Kong. Int J Epidemiol 28: 859-864.
- Chhabra SK, Chhabra P, Rajpal S, Gupta SK (2001) Ambient air pollution and chronic respiratory morbidity in Delhi. Arch Environ Health 56: 58-64.
- Detels R, Donald PT, James WS, Rokaw SN, Massey Jr FJ, et al. The UCLA population studies of COPD: X. A cohort study changes in respiratory function associated with chronic exposure to SOx, NOx, and hydrocarbons. Am J Public Health 81: 350-359.
- Dockery DW, Pope CA, Xu X, et al. An association between air pollution and mortality in six US cities. New England Journal of Medicine 1993, 24: 1753-9.
- Burnett RJ, Brooks J, Dann T, Delocla C, Philips O, et al. (2000) Association between particulate matter and gas phase components of urban air pollution and daily mortality in eight Canadian counties. Inhal Toxicol 12(S4): 15-39.
- Katasouyanni K, Schwartz J, Spix C, Touloumi G, Zmirou D, et al. (1996) Short term effects of air pollution on health: An European approach using epidemiological time series data: The APHEA protocol. J Epidemol Community Health 50(S1): 212-218.
- Katasouyanni K, ToulomiG, Samoli E, Gryparis A, Le Tertre A, et al. (2001) Confounding and effect modifications in short term effects of ambient particles on total mortality: Results from 29 European countries within APHEA 2 project. Epidemiology 12: 521-523.
- Katasouyanni K, Toulomi G, Spix C, Schwartz J, Balducci F, et al. (1997) Short term effects of ambient Sulphur dioxide and particulate matter on mortality in 12 European cities: Results from time series data from APHEA project. Air Pollution and Health: An European Approach. BMJ 314: 1658-1663.
- Samet JM, Dominici F, Curriero FC, Cousac J, Zeger SL (2000) Fine particulate air pollution and mortality in 20 US cities 1987-1994. N Engl J Med 343: 1242-1249.
- Health Effects Institute (2022) Health effects of outdoor air pollution in developing countries of Asia: A literature review. Boston. Available online at: https://www.healtheffects.org/publication/health-effects-outdoor-air-pollution-developing-countries-asia-literature-review
- Central Pollution Control Board (2002) Air quality in seven major cities during 2001 and 2002. Central Pollution Control Board, New Delhi. Accessed on: December 05, 2021. Available online at: http://envfor.nic.in/cpcb/
- Kumar R, Sharma M, Srivastva A, Thakur JS, Jindal SK, et al. (2022) Association of Outdoor Air Pollution with Chronic Respiratory Morbidity in an Industrial Town in Northern India. Arch Environ Health 59: 471-477.
- Indian Standard methods for measurement of air pollution (Nitrogen oxides) (1998). Bureau of Indian Standard, Manak Bhavan, 9 Bahadur Shah Zafar Marg, New Delhi 5182: 6.
- Indian Standard methods for measurement of air pollution (Sulphur dioxide) (2001). Bureau of Indian Standard IS Manak Bhavan, 9 Bahadur Shah Zafar Marg, New Delhi 5182: 2.
- Indian standard methods for measurement of air pollution (Suspended Particulate Matter) (1999). Bureau of Indian Standard, Manak Bhavan, 9 Bahadur Shah Zafar Marg, New Delhi 5182: 4.
- Chen G, Song G, Jiang L, Zhang Y, Zhao N, et al. (2008) Short-term effects of ambient gaseous pollutants and particulate matter on daily mortality in Shanghai, China. J Occup Health 50(1): 41-47.
- Vajanapoom N, Shy CM, Neas LM, Loomis D (2002) Associations of particulate matter and daily mortality in Bangkok, Thailand. Southeast Asian J Trop Med Public Health 33(2): 389-399.
- Tchounwou PB, Yedjou CG, Patlolla AK, Sutton DJ (2012) Heavy metal toxicity and the environment. Exp Suppl 101: 133-164.
- Jyothi NR (2020) Heavy Metal Sources and Their Effects on Human Health. In: Nazal, M. K., Zhao, H., editors. Heavy Metals - Their Environmental Impacts and Mitigation [Internet]. London: IntechOpen. Accessed on: December 18, 2022. Available from: https://www.intechopen.com/chapters/74650
- Kim K-H, Kabir E, Jahan SA (2017) Exposure to pesticides and the associated human health effects. Sci Total Environ 575: 525-535.
-
 Table 1
 -
Table 2
-
Table 3
-
Table 4
-
Table 5


QUICK LINKS
- SUBMIT MANUSCRIPT
- RECOMMEND THE JOURNAL
-
SUBSCRIBE FOR ALERTS
RELATED JOURNALS
- International Journal of Radiography Imaging & Radiation Therapy (ISSN:2642-0392)
- Journal of Psychiatry and Psychology Research (ISSN:2640-6136)
- Journal of Infectious Diseases and Research (ISSN: 2688-6537)
- Journal of Blood Transfusions and Diseases (ISSN:2641-4023)
- Journal of Rheumatology Research (ISSN:2641-6999)
- Journal of Carcinogenesis and Mutagenesis Research (ISSN: 2643-0541)
- Journal of Allergy Research (ISSN:2642-326X)


