Journal of Ageing and Restorative Medicine (ISSN:2637-7403)

Research Article
Development and Validation of Chromatographic and Spectrophotometric Methods for Estimation of Drugs for Chronic Obstructive Pulmonary Disease in Pressurized Meter Dose Inhaler
5603
Views & Citations4603
Likes & Shares
Purpose: Formoterol fumarate and Glycopyrronium bromide combination is used for chronic obstructive pulmonary disease and newly introduced in market. It is necessary to develop suitable quality control methods for rapid and accurate determination of these drugs. The study aimed to develop and validate RP-HPLC and first order derivative spectrophotometric methods for simultaneous estimation of these drugs in pressurized meter dose inhaler.
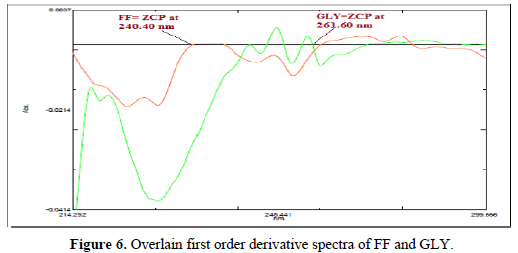
Method: The first method RP-HPLC was developed by the isocratic technique on a reversed-phase enable C-18 column and mobile phase acetonitrile: phosphate buffer pH 5.0 (40:60 v/v). The retention time for Formoterol fumarate and Glycopyrronium bromide was 4.8 min and 6.6 min, respectively. The linearity of the calibration curves for each analyte in the desired concentration range was good (r2 > 0.999) by both the UV and RP-HPLC methods. The second method was based on first order derivative spectrophotometric method where sampling wavelengths were selected at 240.40 nm (zero crossing point of Formoterol fumarate) where Glycopyrronium bromide showed considerable absorbance and at 261.60 nm (zero crossing point of Glycopyrronium bromide) where Formoterol fumarate showed considerable absorbance.
Results and Conclusion: The method showed good reproducibility and recovery with percent relative standard deviation less than 2%. Moreover, the accuracy and precision obtained with RP-HPLC co-related well with the UV method which implied that UV spectroscopy can be a cheap, reliable and less time-consuming alternative for chromatographic analysis. The proposed methods are highly sensitive, precise and accurate and hence successfully applied for determining the assay of a marketed formulation.
Keywords: Formoterol fumarate, Glycopyrronium bromide, First order derivative, RP-HPLC, Validation
INTRODUCTION
Formoterol fumarate (FF) is N-[2-hydro-5-(1-hydro-2-{[1-(4-methoxyphenyl) propan-2-] amino} ethyl) phenyl] formamide (Figure 1). FF is a potent selective β2adrenoreceptor agonist used as bronchodilator to prevent or decrease wheezing and trouble breathing caused by asthma or ongoing lung diseases like COPD (Chronic obstructive pulmonary disease) [1,2]. Glycopyrronium bromide (GLY) is a chemically 1, 1 -dimethylpyrrolidin-1-ium-3-yl 2-cyclopentyl-2-hydroxy phenyl acetate bromide (Figure 1).
GLY is a synthetic anti cholinergic agent with a quaternary ammonium structure. It reduces secretions in the mouth, throat, airways, and stomach before surgery. It used along with other medicines to treat peptic ulcers [3]. The deep literature review revealed that various analytical methods like spectrophotometric, HPLC, HPTLC, stability indicating HPLC, LC-MS and other methods are reported for estimation of FF and GLY individually and in combined with other dosage form and in biological fluids but none of the analytical method is reported for simultaneous estimation of both the drugs in combined pharmaceutical dosage form [4-38].

Therefore, there is a challenge to develop RP-HPLC and UV spectrophotometric method for the simultaneous estimation of Formoterol fumarate and Glycopyrronium bromide. The present study was involved in a research effort aimed at developing and validating a simple, specific, accurate, economical, and precise RP-HPLC and UV spectrophotometric method and for the simultaneous estimation of two drugs in pharmaceutical dosage form.
MATERIALS & METHODS
Reagent and chemicals
FF (Sun Pharmaceutical Pvt. Ltds., Vadodara) and GLY (Vav Life Sciences Pvt Ltd., Mumbai.) were received as gift sample. Marketed formulation containing 4.8 mcg of FF and 9.0 mcg of GLY was purchased from local market. HPLC grade acetonitrile and purified grade potassium di-hydrogen phosphate were purchased from Merck Specialties Pvt Ltd., Mumbai, India. All other reagents employed were of high purity analytical grade. All weighing was done on a calibrated digital balance (Shimadzu ATX 224, Japan). Calibrated glass wares were used throughout the work. Double distilled water and Mili-Q water were used in the UV method and RP-HPLC method respectively.
RP-HPLC METHODS
Instrumentation
The analysis was carried out on a HPLC system (Shimadzu-LC 20AT) equipped with UV detector, pressure controlled by prominence pump and operated by LC solution. Enable C18 column (250 mm × 4.6 mm i.d., particle size 5 μm) was used for separation. Mobile phase used for separation was mixture containing acetonitrile: phosphate buffer pH 5.0 (40:60 v/v). The flow rate was kept at 1.0 mL/min, column temperature was ambient (25°C), eluents were detected by UV detector at 220 nm, and the injection volume was 20 μL.
Chromatographic condition
Optimal composition of the mobile phase was determined to be acetonitrile: phosphate buffer pH 5.0 (40:60 v/v). The mobile phase was filtered through nylon 0.46 µ membrane filter and was degassed before use (30 min). Stock solution was prepared by dissolving FF and GLY (10 mg each) that were weighed accurately and separately transferred into 100 ml volumetric flasks. Both drugs were dissolved in 25 ml of mobile phase to prepare standard stock solutions. After the immediate dissolution, the volume was made up to the mark with mobile phase. These standard stock solutions were observed to contain 100 µg/ml of FF and GLY. Appropriate volume from this solution was further diluted to get appropriate concentration levels according to the requirement. From the above stock solutions, dilutions were made in the concentration range of 0.5-3.0 µg/ml and 1.0-6.0 µg/ml of FF and GLY, respectively. A volume of 20 µL of each sample was injected into column.
Preparation of buffer
15 mM potassium dihydrogen phosphate buffer of pH 5.0 was used for method development. Buffer was prepared by dissolving 2.04 g of potassium dihydrogen phosphate by diluting with Mili-Q water to 1000 ml. The pH was adjusted by 10 M potassium hydroxide using pH meter (Chemiline CL-110, India). The prepared buffer was passed through 0.46 µ membrane filter (Milipore, USA) and the same was used for mobile phase preparation.
Preparation of mobile phase
Mobile phase was prepared by mixing HPLC grade acetonitrile and 15mM potassium dihydrogen phosphate buffer (pH 5.0) in 60:40 (v/v) proportions. Mixture was shaken vigorously and sonicated for 30 min prior to use.
Preparation of stock solutions and test solutions (FF, GLY and binary mixture)
Stock solution (100 µg/ml) of FF, GLY and its binary mixture was prepared by adding accurately weighed 10 mg of FF and GLY and binary mixture of both drugs in 50 ml of mobile phase, then sonicated for 10 min and diluted up to 100 ml. Series of test solutions were prepared in the concentration range of 0.5-3.0µg/ml and 1.0-6.0 µg/ml of FF and GLY respectively, by diluting appropriate volume of the stock solution (100 µg/ml) with mobile phase. The dilutions were first vortexed and then used for further analysis.
Preparation of calibration curve
The calibration curve was prepared by injecting concentration 0.5-3.0µg/ml of FF and 1.0-6.0 µg/ml of GLY and binary mixture solutions manually in triplicate to the HPLC system at detection wavelength of 220.0 nm. Mean of n = 6 determinations was plotted as the standard curve. The calibration curve was tested by validating it with inter-day and intra-day measurements. Linearity, accuracy and precision were determined for both interday and intra-day measurements.
UV SPECTROPHOTOMETRIC METHOD
Instrumentation
The UV method was performed on SHIMADZU double beam spectrophotometer (Model: UV-1800) with 2 nm spectral band width, wavelength accuracy of 0.5 nm using 10 mm matched quartz cuvettes. Data acquisition was done by using UV-probe software version 2.33. The absorption spectra of reference and test solution were carried out over the range of 200-400 nm.
Selection of common solvent
Methanol of analytical reagent grade was selected as a common solvent for developing spectral characteristics of both drugs. The selection was made after assessing the solubility of both drugs in different solvents like water, methanol, chloroform etc.
Preparation of standard stock solutions of FF and GLY
Accurately weighed quantities of FF (10 mg) and GLY (10 mg) transferred to separate volumetric flasks (100 ml), dissolved in methanol (small quantity) and diluted up to mark with methanol (100μg/ml of FF and GLY individually).
METHODOLOGY
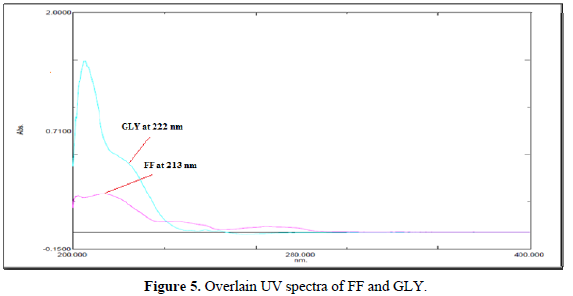
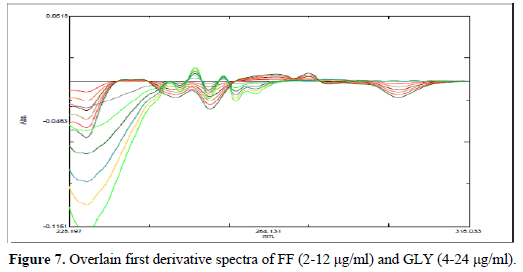
For first order derivative spectrophotometric method, accurate aliquots of FF equivalent to 2-12 μg/ml were transferred from its stock solution (100μg/ml) into a series of 10 ml volumetric flasks and diluted to mark with methanol and mixed well. Accurate aliquots of GLY equivalent to 4-24 μg/ml were transferred from its working solution (100 μg/ml) into a series of 10 ml volumetric flasks and diluted to mark with methanol and mixed well. Considering all the derivative order spectra of FF and GLY from first to fourth derivative, the first derivative order spectra with d (N) =4 was found suitable. The zero-crossing point on the first derivative spectra of one drug, the other drug shows substantial absorbance, these two wavelengths can be employed for the estimation of FF and GLY without any interference from other drug in combined formulations. From the derivatised spectra of prepared mixtures the absorbances were measured at 261.60 nm for FF and 240.40 nm for GLY. These absorbance Vs concentrations were plotted in the quantitative mode to obtain the working curves from which by extrapolating the value of absorbance of the sample solution, the concentration of the corresponding drugs was determined. Both the drugs obeyed Beer's Law.
Validation parameters
Validation was carried out according to ICH guideline [40].
Accuracy
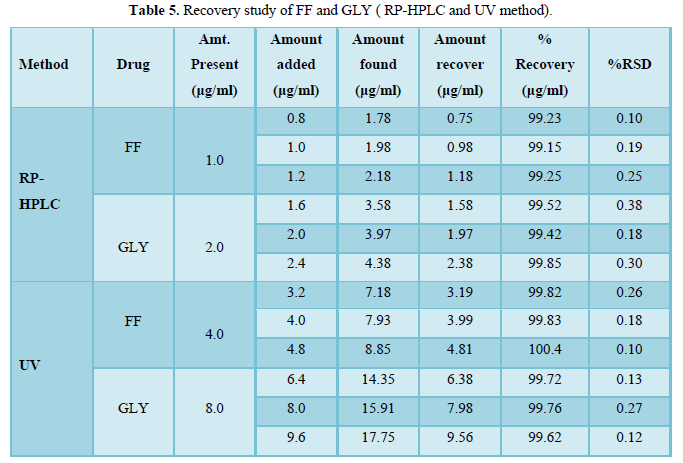
For studying the accuracy of the proposed methods, and for checking the interference from excipients used in the dosage forms, recovery experiments were carried out by the standard addition method. This study was performed by addition of known amounts of FF and GLY to a known concentration of sample solution. The amounts of standard recovered were calculated in terms of mean recovery with the upper and lower limits of % RSD.
PRECISION
Repeatability
The precision of the instrument was checked by repeated scanning and measurement of absorbance of solutions (n = 6) for FF and GLY without changing the parameter of the proposed spectrophotometry methods.
Intermediate precision
Intra-day precision and inter-day precision for the developed methods were measured in terms of % RSD. The experiments were repeated three times a day for intra-day precision and on 3 different days for inter-day precision. The concentration values for both intra-day precision and inter-day precision were calculated three times separately and % RSD were calculated.
Limit of detection (LOD) and limit of quantitation (LOQ)
Limit of detection (LOD) and limit of quantitation (LOQ) were calculated according to the 3s/m and 10s/m criterions, respectively, where s is the standard deviation of intercept (n =6) of the sample and m is the slope of the corresponding calibration curve.
Specificity
The method specificity was assessed by comparing the chromatograms (HPLC) and scans (UV) obtained from the drug and the most commonly used excipient mixture with those obtained from blank (excipient solution in water without drug).
Analysis of FF and GLY in pressurized meter dose inhaler
The pressurized canister was removed from the actuator, and the label and ink were removed from the canister with a suitable solvent. The canister was wiped with tissue paper. The pressurized canister was removed from the actuator, and the stem and valve were cleaned by the diluent. A stainless steel base plate (with three lags and a central circular indentation with a hole about 1.5 mm in diameter) kept inside the 100 mL glass beaker, had about 50 mL of methanol added to it, which insured that the discharge volume did not drop below 25 mm under the surface of the solvent. The pressurized canister was shaken for 15 seconds in an inverted position. The canister was placed invertedly in the hole of the stainless-steel base plate, discharged one spray, and then waited for two seconds. The container was shaken for at least five seconds. Once again, the canister was discharged. The same procedure was repeated another eight times. The pressurized container was removed and washed along with the valve and stem with five to ten mL of diluent. The washing solution was collected in the same 100 mL beaker. The entire beaker (holding solution from two to three washings) content was transferred to the 100 mL volumetric flask. This solution was then diluted up to the mark with methanol and mixed well. Then filtered it through nylon 0.45μ filter and absorbance taken. Aliquot of this solution was diluted to produce the concentration of 4.8 µg/ml for FF and 9 µg/ml for GLY (n = 6). The absorbance of sample solution was measured and the amount of drug present in the sample solution was calculated in the same manner as that of pure mixed standard solution.
RESULTS & DISCUSSION
RP-HPLC and UV-method validation
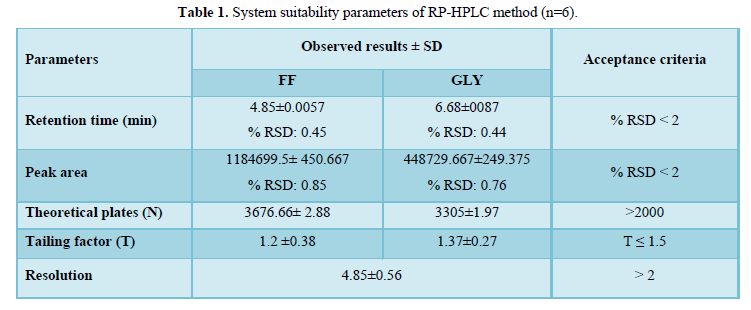
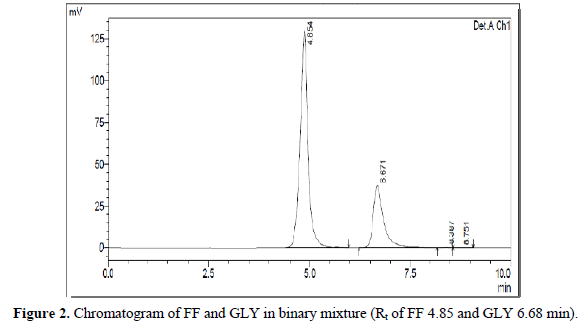
RP-HPLC and UV-Spectrophotometric methods were developed for FF and GLY which can be conveniently employed for routine analysis in pharmaceutical dosage forms and will eliminate unnecessary tedious sample preparations. The chromatographic conditions were optimized in order to provide a good performance of the assay. The retention times (Rt) of FF and GLY were 4.8 min and 6.6 min, respectively. The system suitability parameters were shown in Table 1. The chromatograms have been shown in Figure 2.
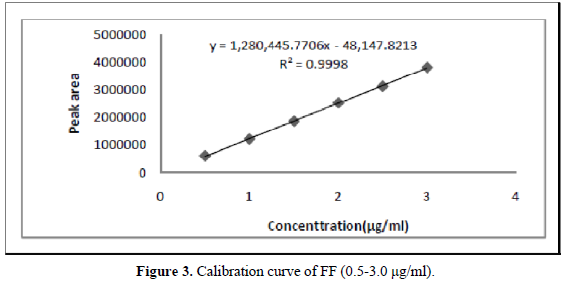
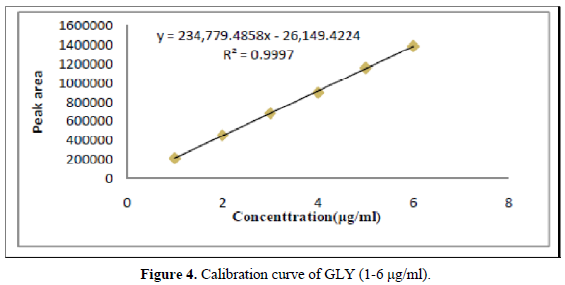
A six-point calibration curve was constructed with working standards and was found linear (r2 = 0.999) for each of the analytes over their calibration ranges. The slopes were calculated using the plot of drug concentration versus area of the chromatogram (Figures 3 and 4). The developed RP-HPLC method was accurate, precise, reproducible and very sensitive. Figures 5, 6 and 7 shows Overlain UV spectra of FF and GLY (Simple and first order derivative spectra).
The regression coefficient of the correlation equation curve was greater than 0.999 (Table 3) and the method was validated with less than 2% RSD (Table 2). All the method validation parameters are well within the limits as specified in the ICH Q2B guidelines as shown in (Table 3). The intra- and inter-day precision (%R.S.D.) at different concentration levels was found to be less than 2% (Table 4).
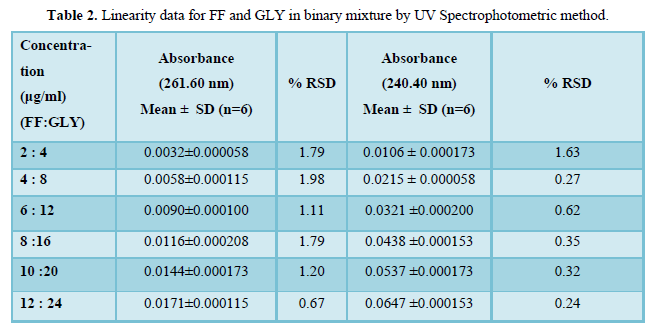
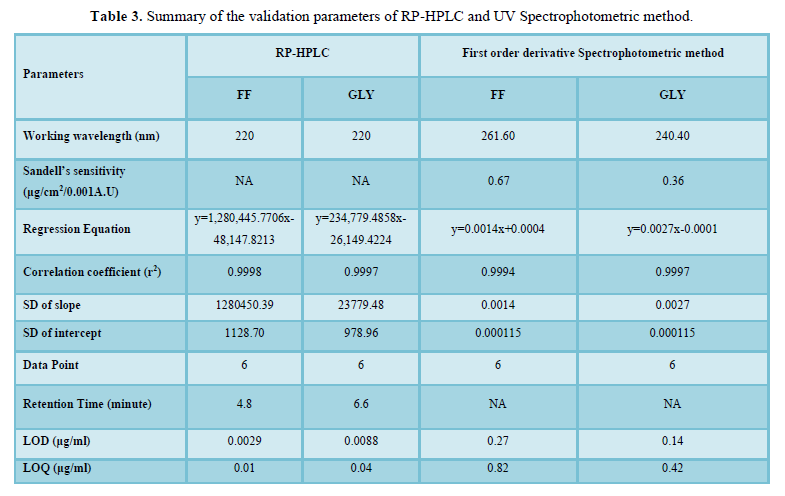
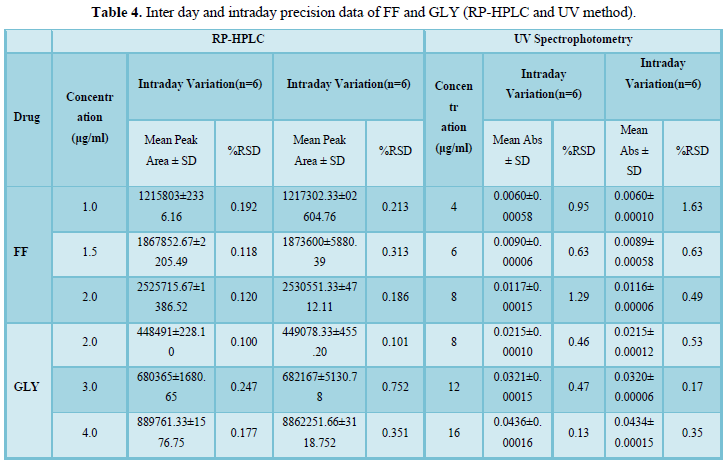
Table 5 lists the percent recovery (content uniformity) of both drugs in the commercial formulations by RP-HPLC and UV methods. Moreover the %R.S.D. (less variation) shows good precision of both developed methods.
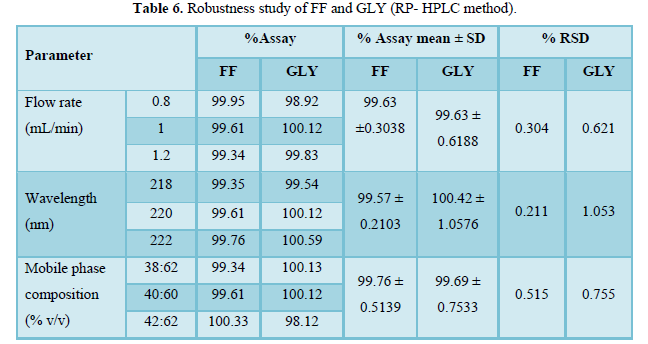
Table 6 shows the robustness study of FF and GLY. % RSD value for all changed parameter was found to be within limit. Hence, it can be considered that the proposed method is robust.
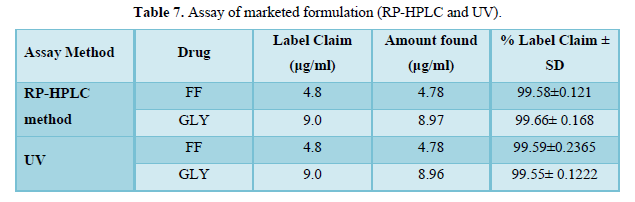
The calculated LOQ and LOD concentrations confirmed that the methods were sufficiently sensitive. Hence, the methods were suitably employed for assaying both the drugs in commercial marketed formulation (Table 7).
Statistical comparison of RP-HPLC and UV methods
Statistical comparison was done on assay results obtained from UV and HPLC methods for marketed formulation by using student’s t-test. Calculated values for t-test were 2.01 for both FF and GLY which is less than t table value (3.15) indicating that there was no significant difference between the RP-HPLC and UV method.
CONCLUSION
Simple, rapid, accurate and precise RP-HPLC as well as first order derivative spectrophotometric methods have been developed and validated for the routine analysis of FF and GLY in API and pressurized meter dose inhaler. Both methods are suitable for the simultaneous determination of FF and GLY in multi-component formulations without interference of each other. The developed methods are recommended for routine and quality control analysis of the investigated drugs in two component pharmaceutical preparations. The amount found from the proposed methods was in good agreement with the label claim of the formulation. Also, the value of standard deviation and coefficient of variation calculated were satisfactorily low, indicating the suitability of the proposed methods for the routine estimation of pharmaceutical dosage form.
ACKNOWLEDGEMENT
The authors express their sincere thanks to, Sun Pharmaceutical Pvt. Ltds., Vadodara and Vav Life Sciences Pvt Ltd., Mumbai, India for supplying the gift samples of Formoterol fumarate and Glycopyrronium bromide, respectively. Authors also extend their thanks to the management, Pioneer Pharmacy Degree College, Vadodara for providing the facilities to carry out the present work.
- O’Neil MJ (2006) The Merck Index an encyclopedia of Chemicals, Drugs and Biologicals. (14th edn) Merck & Co Inc 4244
- Sweetman SC (2007) Martindale the Complete Drug Reference. (35thedn) Pharmaceutical press, London, 925
- NPS Radar (2014) Glycopyrronium bromide (Seebri) for chronic obstructive pulmonary disease. Available online at: http://www.nps.org.au/publications/health-professional/nps-radar/2014/april-2014
- Merey HA (2016) Validated chromatographic methods for the simultaneous determination of Mometasonefuroate and Formoterolfumaratedihydrate in a combined dosage form. Bulletin of Faculty of Pharmacy, Cairo University, Vol 54, pp: 99-106
- Patil A S (2015) Stability–indicating High Performance Thin Layer Chromatography /densitometry estimation of Formoterolfumaratedihydrate in bulk and capsules. Int J Adv Pharm Analy 5: 80-84
- Appala SR (2010) A high performance liquid chromatography assay for Formoterol in bulk drug and its dosage forms. Int J Biomed Adv Res 2: 18-24
- Parmar VK (2014) Sensitive and Robust Methods for Simultaneous Determination of Beclomethasone Dipropionate and Formoterol Fumarate Dihydrate in Rotacaps. J Chromatograph Sci 1-12
- Shah BD (2011) Analytical Method Development and method validation of Tiotropium Bromide and FormoterolFumarate metered dose inhaler (MDI) by using RP-HPLC Method. Asian J Biochem Pharm Res 1: 2231-2560.
- Srinivasarao K (2012) Validated Method Development for Estimation of FormoterolFumarate and MometasoneFuroate in Metered Dose Inhalation Form by High Performance Liquid Chromatography. Anal Bioanal Tech 3: 1-4.
- Kale NR (2014)Development and validation of stability indicating RP-HPLC method for simultaneous estimation of formoterolfumarate and budesonide in metered dose inhaler formulation. World J Pharm Res 3: 1387-1399.
- Gujarati PZ (2014) Development and validation of stability indicating RP-HPLC method for simultaneous estimation of mometasonefuroate and formoterolfumarate in combined dosage form. Pharmacophore 5: 219-230.
- Pai N (2013) Development and validation of RP-HPLC method for estimation of Formoterolfumarate and budesonide in pressurized meter dose inhaler form. Pelagia Res Library 4: 15-25.
- Rao KVS (2006) Reverse phase high performance liquid chromatography analysis of Formoterolfumarate in bulk and its pharmaceutical dosage form. Asian J Chem 18: 807-812.
- Trivedi RK (2012) A Rapid, Stability-Indicating RP-HPLC Method for the Simultaneous Determination of FormoterolFumarate, Tiotropium Bromide and Ciclesonide in a Pulmonary Drug Product. Scient Pharma 80: 591-603.
- Gowekar NM (2016) Simultaneous Estimation of FormoterolFumarate Dihydrate and Fluticasone Propionate in Dry Powder Inhalation Formulation by RP-HPLC. Int J Pharm Tech Res 9: 164-170.
- Raval PP (2014) Estimation of Fluticasone propionate in nasal preparation and combination with Formoterolfumarate in inhalation preparation.World J Pharmacy Pharm Sci 3: 1148-1160.
- McCrea C (2009) Chiral HPLC analysis of Formoterol stereoisomer’s and thermodynamic study of their inter conversion in aqueous pharmaceutical formulations. J Pharm Biomed Anal 49: 632-637.
- El-Bagary RI (2015) Forced degradation of Mometasonefuroate and development of two RP-HPLC methods for its determination with Formoterolfumarate or salicylic acid. Arabian J Chemistry 9: 493-505.
- Jain HK (2016) Stability indicating HPLC method for estimation of Formoterolfumarate and Mometasone furoate in respicaps dosage forms. Indian J Chem Technol 23: 405-411.
- Mazzarino M (2013) A simplified procedure for the analysis of Formoterol in human urine by liquid chromatography–electro spray tandem mass spectrometry: Application to the characterization of the metabolic profile and stability of Formoterol in urine. J Chromatogr B 931: 75-83.
- Campestrini J (1997) Automated and sensitive method for the determination of Formoterol in human plasma by high-performance liquid chromatography and electrochemical detection. J Chromatogr B, Biomed Sci Appl 704: 221-229.
- Siraj AS (2011) Development of reverse phase high performance liquid chromatography method and its validation for estimation of Formoterolfumaraterota caps. Int J Pharm Sci Res 2: 319-324.
- Nadrassan DK (2007) Validation of high-performance liquid chromatography assay for quantification of formoterol in urine samples after inhalation using UV detection technique. J Chromatogr B 850: 31-37.
- Prasad AVVS (2006) Simultaneous spectrophotometric determination of Formoterol fumarate and Budesonide in combined dosage form. Indian J Chem Technol 13: 81-83.
- Bhangale PR (2013) Spectroscopic method for simultaneous estimation of Formoterolfumarate and Mometasonefuroate in rotacaps. Int Res J Pharm 4: 220-223.
- Gousuddin M (2011) Development and validation of spectrometric method for estimation of Formoterol bulk drug and its pharmaceutical dosage forms. Int J Pharmacy Pharm Sci 3: 306-309.
- Gurjar NM (2012) Development of first derivative spectroscopy method for estimation of budesonide and formoterol in combine dosage form: Pharma science monitor. Int J Pharm Sci 3: 82-92.
- Duygu T (2016) Validated spectrophotometric method for determination of Formoterolfumaratedihydrate in bulk and dosage form using methyl orange as ion pair reagent. Marmara PharmJ 20: 275-279.
- Zanwar AS (2014) Spectroscopic methods for the simultaneous estimation of mometasonefuroate and Formoterolfumarate in rota caps. Indo Ame J Pharm Res 4: 5928-5933.
- Jamdar P (2015) Isoabsorbtive method for the simultaneous estimation of Neostigmine methyl sulphate and Glycopyrrolate in injection form. FSJ Pharmacy Res 4: 5-8.
- Venketshwaran TG (2006) HPLC determination of ondansetron-atropine and ondansetron-Glycopyrrolate mixtures in 0.9% sodium chloride injection. J Liquid Chromatograph 18: 2647-2659.
- Gandala K (2011) RP-HPLC method development and validation for estimation of Glycopyrrolate in bulk and tablet dosage form. Asian J Pharm Clini Res 4: 37-40.
- Nebiu D (2007) Determination of (R,R)-Glycopyrronium bromide and its related impuritiesby ion-pair HPLC. Pharmazie 62: 406-410.
- Rumpler MJ (2011) Validation of a Liquid Chromatography–Tandem Mass Spectrometry Method for Quantification of Glycopyrrolate in Horse Plasma. J Anal Toxicol 35: 656-664.
- Storme ME (2008) Quantitative determination of Glycopyrrolate in human plasma by liquid chromatography-electro spray ionization mass spectrometry: The use of ion pairing agent during both liquid–liquid extraction and liquid chromatography. J Chromatogr B 876: 24-30.
- Maha FG (2016) Simultaneous spectrophotometric determination of Indacaterol and Glycopyrronium in a newly approved pharmaceutical formulation using different signal processing techniques of ratio spectra. Spectrochimica Acta Part A: Molecular and Biomolecular Spectroscopy 157: 251-257.
- Mishra S (2016) Analytical method validation of HPLC method for assay of anti cholinergic drug in parenteral formulation. Int J Pharm Res Scholars 5: 101-104.
- Chitlange SS (2015) Development and validation of HPTLC method for Glycopyrrolate in single dose tablet formulation. Inventi Rapid/Impact: Pharm Analysis & Quality Assurance 4: 171-175.
- Akapo SO (2003) Validation of a rapid RP-HPLC method for the assay of Formoterol and its related substances in Formoterolfumaratedihydrate drug substance. J Pharm Biomed Anal 33: 935-945.
- ICH Q (R1) Harmonized tripartite guideline, Validation of analytical procedures: Text and methodology. International Conference on Harmonization ICH, Geneva.
-
 Table 1
 -
Table 2
-
Table 3
-
Table 4
-
Table 5
-
Table 6
-
Table 7


QUICK LINKS
- SUBMIT MANUSCRIPT
- RECOMMEND THE JOURNAL
-
SUBSCRIBE FOR ALERTS
RELATED JOURNALS
- Journal of Psychiatry and Psychology Research (ISSN:2640-6136)
- Journal of Rheumatology Research (ISSN:2641-6999)
- Journal of Nursing and Occupational Health (ISSN: 2640-0845)
- Journal of Cancer Science and Treatment (ISSN:2641-7472)
- Journal of Infectious Diseases and Research (ISSN: 2688-6537)
- Journal of Otolaryngology and Neurotology Research(ISSN:2641-6956)
- Journal of Neurosurgery Imaging and Techniques (ISSN:2473-1943)


