Research Article
Genetic Variation of Three Tetramer Short Tandem Repeats Using Miniplex
2835
Views & Citations1835
Likes & Shares
Tetramer short tandem repeats (STRs) are the rich source of highly polymorphic markers in the human genome hence are considered ideal for identification of an individual in forensic. They can be multiplexed by PCR and analyzed by automated genetic analyzers. However, with degraded forensic samples, very often problem occurs in genotyping large amplicons. To overcome these problems, miniplex is a method of choice. In the present studies, a miniplex of three short tandem repeat (STR) of Tyrosine hydroxylase gene (TH01), Lipoprotein lipase (LPL) gene and Thyroid peroxidase gene (TPOX) was developed and studied for the distribution of alleles and genotype frequencies in random samples from people residing in Mumbai city. The methodology includes extraction of DNA from dried blood stains, Polymerase chain reaction (PCR) amplification using fluorescent based primers specific for the intron 1 of the tyrosine hydroxylase gene, intron 6 of the LPL gene and intron 10 of TPOX gene. The detection of amplified products was carried out on ABI 3100 Genetic Analyzer (Applied Biosystems) and the data was further analyzed using GENEMAPPER software. No deviation from Hardy-Weinberg equilibrium was observed for allele and genotype distribution. The homozygosity percentage for TH01 was 27.0, for LPL was 29.7 and for TPOX was 73.0 and the heterozygosity percentage was found to be 73.0 for TH01, 70.3 for LPL and 77.9 for TPOX gene. These results suggested that the TH01, LPL and TPOX markers are highly polymorphic and therefore can be used as an effective tool for narrowing down the identity of an individual in population.
Keywords: Forensic, Identification, DNA, Short tandem repeats, Miniplex
Abbreviations: DNA: Deoxy Ribose Nucleic Acid; STRs: Short Tandem Repeats; TH01: Tyrosine Hydroxylase Gene; LPL: Lipoprotein Lipase Gene; TPOX: Thyroid Peroxidase Gene; FSS: Forensic Science Service; POP4™: Performance Optimized Polymer 4; PCR: Polymerase Chain Reaction; PD: Power of Discrimination; PE: Power of Exclusion; PIC: Polymorphism Information Content
INTRODUCTION
In the early 1990’s STRs were first described an effective tool for human identification [1]. Since then, the Forensic Science Service (FSS) began to look for brand spanking loci and study population variation with variety of STR markers. The primary FSS multiplex applied to forensic casework included the four loci: TH01, vWA, FES/FPS and F13A1 [2]. Promega Corporation provided FFFL multiplex including F13A1, F13B, FES/FPS, and LPL loci while Applied Biosystems included CSF1PO, TPOX, TH01, vWA, D16S539, D7S820, D13S317 and D5S818 loci in their multiplex kit named Power plex kit [3]. Seeing the promise of STR typing for forensic use the FBI laboratory of U.S. conducted a study on STR markers and evaluated 17 candidate loci [4]. They conducted performance studies for every locus and established a population database. Early studies of STR markers used polyacrylamide gels for separation and their detection was done by silver staining [5] but because of continuous research in molecular biology and genetics, development of advance technology, fluorescence based detection methods emerged and separation of STR markers was meted out by automated capillary electrophoresis instrument ABI 310 or ABI 3100 genetic analyzer [6-8].
The current commercially available multiplex kits amplifies over and above 20 STR loci and generates amplicon sizes from 100 to 450 base pairs (the cost is 25-30 $ per sample). In degraded forensic samples, very often, DNA is fragmented. Hence, STR loci with larger amplicon sizes over 300 base pairs are either not amplified or the amplicon size decreases proportionally. Efforts are been taken to outspread the efficiency of STR markers in degraded biological samples [9-10]. Mini-STRS were developed, by making new primers which are near to STR repeat region, thus reducing the size of amplicon (80 to 300bp) [10-12]. The tiny size of amplicons increases the amplification efficiency in fragmented DNA. Besides this, mini-STRS amplifies three to five loci with few fluorescent dyes, which makes them less expensive than the commercially available kits. Within the present study, a miniplex was designed for 3 loci TPOX, TH01 and LPL. The distribution of alleles and other parameters were studied for unrelated individuals in Mumbai population.
In STRs, the alleles are present in natural numbers. A population is characterized by a collection of allele frequencies. A locus is termed highly polymorphic when the frequency of the foremost common allele is a smaller amount (0.99) and also the assemblage of all the allele frequency is more than 0.01 [13-14]. Allele frequency refers to the quantity of copies of an allele in a population divided by the entire number of all alleles present within the population. The prospect of rare allele to grant rise to a specific genotype containing them becomes even rare. Genotype frequency refers to the quantity of people with a selected genotype divided by the full number of persons. If there are n number of alleles present for a cistron, then n (n+1)/2 genotypes are possible [15]. Thus, theoretically an LPL locus should have 36 genotypes possible, but in practice survival of the fittest eliminates detrimental alleles selectively against homozygotes or maintains genetic variation by assortment for heterozygotes [16]. Therefore such data are essential prerequisites for studying the genetics of any population.
MATERIAL AND METHODS
Sample collection:
Blood samples were collected from 144 healthy, unrelated subjects. Each donor’s age and sex were recorded. Blood stains were prepared on cotton cloth and dried at room temperature. The stains were labeled and were placed in a paper envelope and stored at 4°C for further analysis.
DNA extraction and PCR Amplification:
DNA was extracted by organic extraction method using lysis buffer and proteinase K for digestion of proteins present in the blood [17]. Digested Proteins were separated by adding phenol and the aqueous layer was separated in fresh tubes and DNA was precipitated by adding ethanol. Submerged electrophoresis using 1% agarose gel was carried out to separate DNA bands. DNA bands were observed under Bio-Rad UV transilluminator.
PCR amplification:
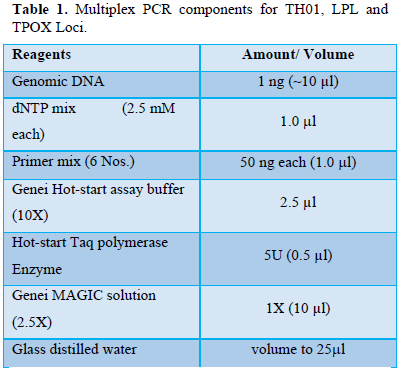
Multiplex PCR was performed on Gene Amp 9700 (Applied Biosystems) Thermal cycler [18]. The PCR conditions were standardized by varying template concentration, annealing temperature, by adding different quantities of forward and backward primers, enzyme Hot-start Taq polymerase etc. Table 1 shows PCR components used for miniplex.
PCR cycle condition:
Thin-walled micro reaction tubes were used for amplification of DNA samples in thermo cycler. Hot start Taq polymerase enzyme was activated at 94°C for 5 min. Each PCR cycle consisted of denaturation at 94°C for 1 min, annealing at 55°C for 1 min, and extension at 72°C for 2 min; and a final extension at 72°C for 7 min. 28 such cycles were run for DNA amplification.
Genotyping and data analysis:
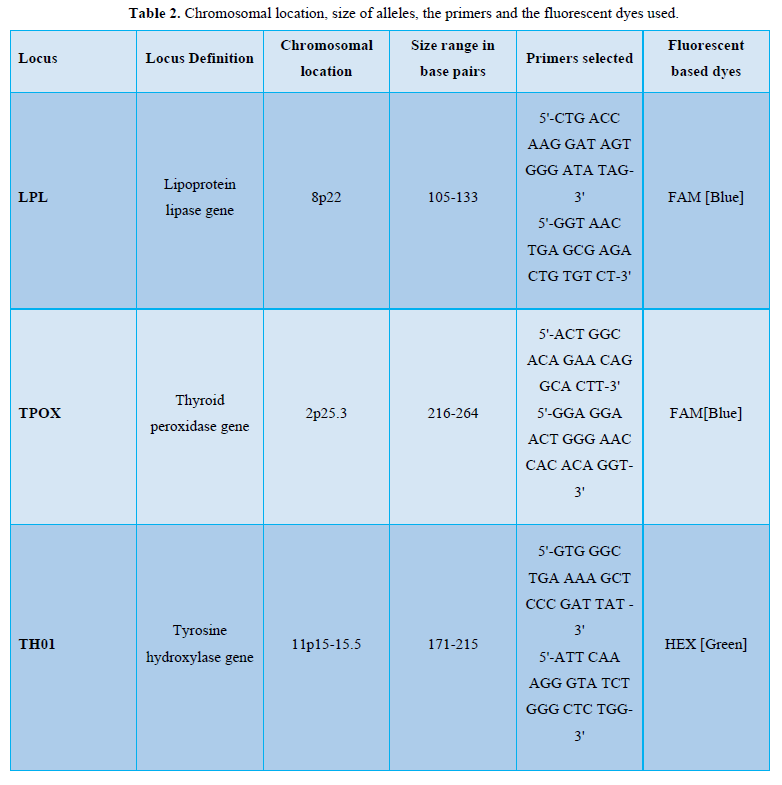
All samples were run on the capillary electrophoresis on ABI 3100 automatic analyzer. Table 2 gives the chromosomal location, size of alleles, primers selected and names of fluorescence dye used for detection of a particular locus on genetic analyzer. For the ABI PRISM 3100 Genetic Analyzer [6-7], 1.5 µl of amplicons and 0.3 µl of ROX-500 Internal Lane Size Standard were added to 12µl of deionized formamide and denatured at 95°C for 3 min. This mixture was loaded and electrophoresed at 15 kV in Performance Optimized Polymer 4 (POP4™).
Statistical analysis:
The chi-square test between observed and expected values on Hardy-Weinberg equilibrium genotype frequencies homozygote and heterozygote was calculated. Parameters of forensic interest, such as the power of discrimination (PD) a probability of exclusion of a non-father in a randomly chosen paternity suit and mean exclusion chance (ME) probability of two person having identical genotypes were calculated.
RESULTS AND DISCUSSIONS
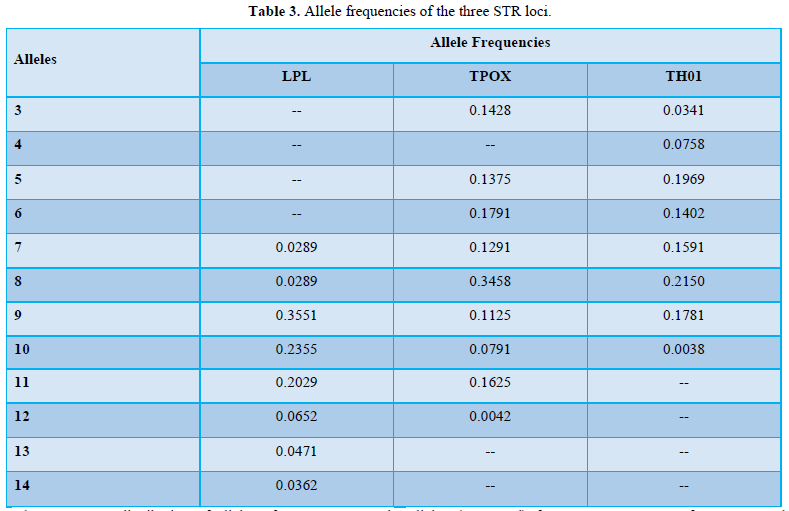
In the present study, out of the 36 possible genotypes from the eight alleles, 26 genotypes were observed in LPL locus, in TH01 out of 210 possible genotypes, from twenty alleles, 23 genotypes were observed and in TPOX locus, 26 genotypes were observed out of 120 possible genotypes from fifteen alleles. Table 3 shows the distribution of allele frequencies of those three loci. No micro-variant alleles were observed within the studied population.
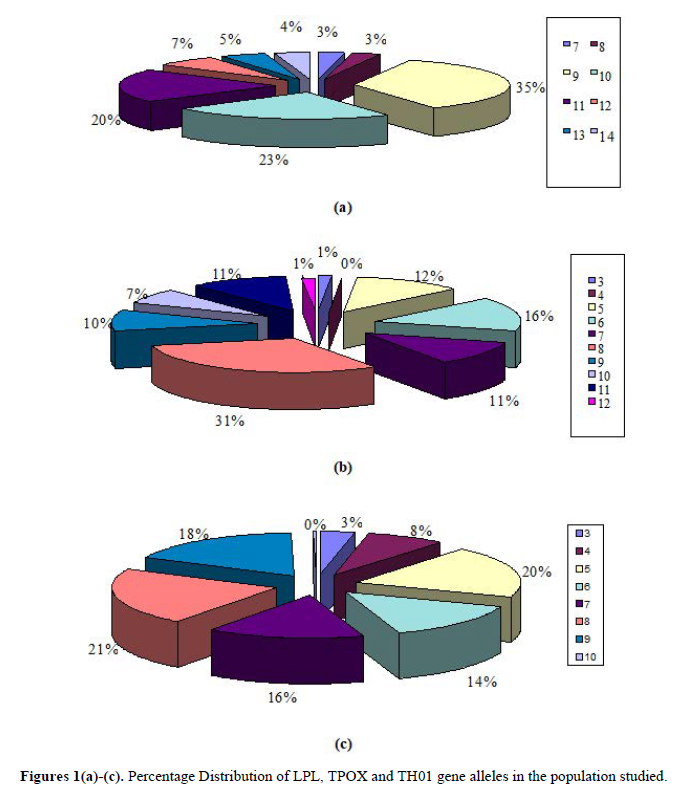
The percentage distribution of alleles of LPL, TPOX and TH01 loci in the population studied is shown in Figures 1(a)-1(c). For LPL locus, allele 9 was the foremost common allele found within the population studied and alleles 7 and 8 were present in very small population. Similarly, in TPOX locus, Allele 8 was the foremost common allele present within the subjects studied whereas alleles 3 and 12 were present in very small population. In TH01 locus, alleles 8, 5, and 9 were the foremost common alleles found in population studied and allele 3 was present in very small population. Allele 10 was the least spread allele found within the subjects studied.
Using the allelic frequencies calculated for all the three loci, a locus will be defined as polymorphic or monomorphic. By general definition, if the frequency of the foremost common allele is 0.99 or more and if all the opposite alleles combined have a frequency of 0.01 or less, then that gene or locus is taken into account as monomorphic, otherwise, it is polymorphic. The results of the current study showed that the locus of LPL gene is extremely polymorphic, because the frequency of the foremost common allele 9 was 0.35 and also the collection of all the alleles (expressed) frequency was 0.92. Furthermore, the loci of TPOX gene along with that of TH01 gene are highly polymorphic. The frequency of the foremost most common allele 8 for TPOX was 0.3458 and for TH01 was 0.215 and therefore the aggregation of all the alleles (expressed) frequency was 1.2926 for TPOX and 1.003 for TH01 (Table 3). Thus the presence or absence of alleles together with their percentage would help in the process of identification or individualization in various cases/ or for elimination of the probability of a personal within the event as the case could also be. A larger sample study would aid in data collection for preparation of database for comparison and identification of individuals.
Hardy Weinberg Equilibrium (HWE) test was applied to calculate the expected allele frequency from the observed allele frequency. For LPL locus the observed homozygote allele frequency was 41 and observed heterozygote was 194. The expected frequency of homozygote and heterozygote for LPL locus was 40.97 and 193.96 respectively. Similarly, the observed homozygote allele frequency for TPOX was 32 and observed heterozygote was 217 and also the expected frequency for homozygote and heterozygote was 31.84 and 214.07 respectively. The observed homozygote allele frequency for TH01 locus was 36 and observed heterozygote was 186 whereas; the expected frequency of homozygote and heterozygote for TH01 was 35.97 and 185.97 respectively. The observed and expected values were near one another, which indicated that the studied population is in HWE and obeys Null Hypothesis (Ho) i.e. allele combinations are independent of one another.
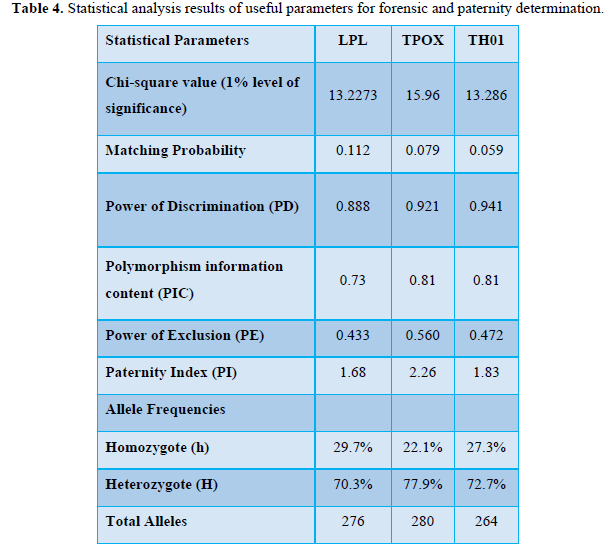
Chi-square test also confirmed these results. For LPL locus, calculated Chi-square value (X2) 13.2273 for 7 degrees of freedom was significant at 1% level. Tabulated chi-square value for 7 degree of freedom at 1% level of significance was 18.475. Since calculated value of chi-square (13.2273) was a lesser amount than 18.475. Null hypothesis (Ho) was accepted and hence may be concluded that alleles were independently distributed within the population as their homozygosis and heterozygosis was significant at 1% level. The chi-square value for TH01 was 13.286 and for TPOX locus was 15.96 for 7 degrees of freedom at 1% level of significance respectively (Table 4).
Another technique for measuring genetic variation in a population is to calculate heterozygosity and homozygosity percentage. Heterozygosis (H) is that the proportion of heterozygous individuals present within a population and homozygosis (h) is that the proportion of homozygotes present within the population [24-25]. For a monomorphic locus the amount of heterozygosity is zero. In the current studies the average heterozygosity was 73.64% and therefore, homozygosity was 26.37%. In TPOX locus, heterozygosity was 77.9%, whereas, in TH01 and LPL heterozygosity was 72.7% and 70.3% respectively (Table 4). Higher heterozygosity indicated that the locus is extremely polymorphic and more allele diversity existed and thus there’s better chance of identification of a personal in random sample matching, which is a necessary part of forensic studies. Total number of alleles in LPL locus was 276, in TPOX was 280 and in TH01 was 266. At the micro satellite loci, genetic variation among individuals of the identical population increases regularly with the population’s complexity [26]. Excess homozygosis indicates consanguineous mating within the population (the Wahlund effect). Therefore, study of alleles on LPL, TH01 and TPOX loci is of practical importance in forensic match probability calculations and also in explaining the occurrence of recessive genetic issues.
The loci with larger mutation rates shows greater heterozygosity within subpopulations, and exhibits a smaller proportional heterozygote deficiency (GST) and, hence, the impact of population sub-structuring is minimal at the hyper variable DNA loci (an order of magnitude smaller than that of the blood group and protein loci). The loci (LPL, TH01 and TPOX) have a lower mutation rate (0.05) [15] and no heterozygote deficiency had been observed.
Other than the allelic and genotype frequency calculations, the power of discrimination (PD), the power of exclusion (PE), the polymorphism information content (PIC) have been also studied to seek out the usefulness of LPL, TH01 and TPOX as gene marker (Table 4).
The individuals in a very given population have n number of loci with variable alleles on their chromosomes. The frequency of an allele is that the percentage of loci that the allele occupies within the population. These allele frequencies were utilized for calculation of probability of match (P). The probability of obtaining a match between two distinct and unrelated individuals was 0.112 for LPL, 0.079 for TPOX and 0.059 for TH01. It’s a rare risk that two individuals selected indiscriminately will have identical genotype at the locus. Probability is typically viewed on a continuum between zero and one [27]. Lower extreme of zero indicates that it is unfeasible for an occurrence to manifest whereas as upper end when probability is adequate to 1, indicated that the event occurred. This statistical information in forensics provide the probability of match of a suspect with the questioned source and the probability values of genetic and demographic features of collected samples in numerous populations. On this admire the contribution of LPL, TH01 and TPOX loci is extremely critical.
In forensic DNA profiling, the statistics is additionally used for assessment of proof in paternity determination, identification of deceased in murder, mass disaster cases, and suspects in rape cases and for anthropological analysis of population. The statistical tests performed on these numbers are to gauge the worth of evidence. The power of discrimination (PD) is equivalent to 1- probability of match [25]. PD is that the average number of individuals one should survey before finding similar comparable genotype pattern among randomly selected individuals. This can be one in all of the vital parameters studied and used for individual identification and population research. Low power of discrimination indicates decrease polymorphism and least degree of knowledge from that locus. Over 20 alleles were observed at LPL, TH01 and TPOX loci providing maximum discriminatory strength to these markers. The PD for the three loci studied were within the range 0.88 - 0.95 clearly illustrated very high intra population diversity within the studied population.
Polymorphism Information Content (PIC) indicates what percentage alleles a particular marker has and the manner those alleles divide evenly. In paternity cases, it reflects the probability that a given offspring of a parent carrying a rare allele at a locus will allow deduction of the parental genotype at the locus and it’s determined by summing the mating frequencies multiplied by the probability that an offspring are going to be informative. PIC for LPL locus was 0.73, for TPOX and TH01 loci was 0.81 respectively (Table 4).
The power of exclusion (PE) that’s calculated as the sum of the squares of the frequencies of all the genotypes and indicates the probability that the two randomly chosen person don’t have the same genotype was observed to be 0.433 in LPL, 0.560 in TPOX and in TH01 it absolutely was 0.472 (Table 4).
CONCLUSION
Crime samples are mainly uncovered to environmental insults due to this DNA gets fragmented or degraded. Fragmented DNA and degraded DNA make the task of amplification difficult. Efficiency to get a complete DNA profile decreases due to reduced amplification. Very often there may be imbalance in the height of the peak and the possibility of an allele to drop out increases. To overcome this, it is essential to amplify smaller number of loci at a time. Therefore, there is a pressing want to develop more miniplex, standardized them, examine polymorphisms and use them regularly in cases where DNA is degraded or fragmented. A massive Heterozygosity of the system offers good information in genetic linkage applications. The current study, showed large individual diversity within random populations. The study also demonstrated that Micro satellite - LPL, TPOX and TH01 loci are the highly polymorphic loci in the genome. The study explicitly proved the utility of LPL, TPOX and TH01 loci in deciphering genetic diversity of population. The system would seem to be very useful for forensic application, exclusion in paternity cases and in the evaluation of degraded samples.
- Edwards A, Hammond HA, Jin L, Caskey CT, Chakraborty R (1992) Genetic variation at five trimeric and tetrameric tandem repeat loci in four human population groups. Genomics 12: 241-253.
- Kimpton CP, Fisher D, Watson S, Adams M, Urquhart A, et al. (1994) Evaluation of an automated DNA profiling system employing multiplex amplification of four tetrameric STR loci. Int J Legal Med 106: 302-311.
- Lins AM, Micka KA, Sprecher CJ, Taylor JA, Bacher JW, et al. (1998) Development and population study of an eight locus short tandem repeat (STR) multiplex system. J Forensic Sci 43: 1168-1180.
- Butler JM (2006) Genetica and genomics of core short tandem repeat loci used in human identity testing. J Forensic Sci 51: 253-263.
- Lins AM, Sprecher CJ, Puers C, Schumm JW (1996) Multiplex sets for the amplification of polymorphic short tandem repeat loci silver stain and fluorescence detection. Bio Techniques 20: 882-889.
- Butler JM, Buel E, Crivellente F, McCord BR (2004) Forensic DNA typing by capillary electrophoresis using the ABI Prism 310 and 3100 genetic analyzers for STR analysis. Electrophoresis 25: 1397-1412.
- Krenke BE, Tereba A, Anderson SJ, Buel E, Culhane S, et al. (2002) Validation of a 16-locus fluorescent multiplex system. J Forensic Sci 47: 773-785.
- Collins PJ, Hennessy LK, Leibelt CS, Roby RK, Reeder DJ, et al. (2004) Development validation of a single tube amplification of the 13 CODIS STR loci, D2S1338, D19S433 and amelogenin: The AmpFlSTR Identifiler PCR amplification Kit. J Forensic Sci 49: 1265-1277.
- Kwang-Man W, Seung-Hwan L, Choi CY (2016) Differential pre-amplification of STR loci for fragmented forensic DNA profiling. Electrophoresis 37: 3002-3009.
- Coble MD, Butler JM (2005) Characterization of new mini STR loci to aid analysis of degraded DNA. J Forensic Sci 50: 43-53.
- Hill CR, Kline MC, Coble MD, Butler JM (2008) Characterization of 26 mini STR loci for improved analysis of degraded DNA samples. J Forensic Sci 53(1): 73-80.
- Raimann PE, Mariot RF, Avila E, Alho CS (2018) Internal validation of the Non codis Mini STR NCO1 andNCO2 for use in forensic casework. J Criminol Forensic Stud 1(2): 180006.
- Smith JC, Newton CR, Alves A, Anwar R, Jenner D, et al. (1990) Highly Polymorphic minisatellites DNA probes, Further evaluation for individual identification and paternity testing. J Forensic Sci Soc 30: 3-18.
- Wyman AR, White R (1980) A highly polymorphic locus in human DNA. Proc Natl Acad Sci USA 77: 6754-6758.
- Butler JM (2002) Forensic DNA Typing, second edition, Elsevier, Academic Press.
- Robertson A (1975) Gene Frequency Distributions as a test of Selective Neutrality. Genetics 81: 775-785.
- Maniatis T, Fritsch EF, Sambrook J (1989) Molecular Cloning: A Laboratory Manual, Cold Spring Harbor Laboratory, Cold Spring Harbor, New York.
- Morling N (1998) Amplification of short tandem repeat loci using PCR Methods. Mol Biol 98: 173-180.
- Zulian G, Hobbs HH (1990) Tetranucleotide polymorphism on the LPL (LIPOL) gene. Nucleic Acid Res 18: 4958.
- Glock B, Schwartz DWM, Schwartz-Jungl EM, Mayr WR (1996) Allelic ladder characterization of the short tandem repeat polymorphism in Intron 6 of the lipoprotein lipase gene and its application in an Austrin Caucasian population study. J Forensic Sci 41: 579-581.
- Berschick P, Henke L, Henke J (1994) Analysis of the short tandem repeat polymorphism TC 11(HUMTH01): Allele frequencies and family studies. Adv Forensic Haemogenetics 5: 469-471.
- Nellemann L, Moller A, Morling N (1994) PCR typing of DNA fragments of the short tandem repeat (STR) system HUMTH01 in Danes and Greenland Eskimos. Forensic Sci Int 68: 45-51.
- Nagai A, Yamada S, Watanabe Y, Bunai Y, Ohya I (1996) Analysis of the STR loci HUMF13A01, HUMFXIIIB, HUMLIPOL, HUMTH01, HUMTPOX and HUMVWFA31 in a Japanese population. Int J Leg Med 109: 34-36.
- Barbujani G, Magagni A, Minch E, Luca LC (1997) An apportionment of human DNA diversity. Proc Natl Acad Sci USA 94: 4516-4519.
- Lufig MA, Richeys (2001) DNA and forensic science. New Engl Law Rev 35(3): 609-613.
- Jin L, Chakraborty R (1995) Population structure, stepwise mutations, heterozygote deficiency and their implications in DNA forensics. Heredity 74: 274-285.
- Gupta SC, Kapoor VK (1983) Fundamentals of Mathematical Statistics, Eighth edition, Sultan chand and sons, Delhi.
-
 Table 1
 -
Table 2
-
Table 3
-
Table 4


QUICK LINKS
- SUBMIT MANUSCRIPT
- RECOMMEND THE JOURNAL
-
SUBSCRIBE FOR ALERTS
RELATED JOURNALS
- Journal of Spine Diseases
- Stem Cell Research and Therapeutics (ISSN:2474-4646)
- Journal of Immunology Research and Therapy (ISSN:2472-727X)
- Dermatology Clinics and Research (ISSN:2380-5609)
- International Journal of Clinical Case Studies and Reports (ISSN:2641-5771)
- Ophthalmology Clinics and Research (ISSN:2638-115X)
- International Journal of Surgery and Invasive Procedures (ISSN:2640-0820)


