Journal of Economics, Business and Market Research (ISSN: 2642-022X)

Research Article
STUDY OF CUSTOMER SATISFACTION FOR BEAUTY CARE SERVICES IN THE NORTHERN PROVINCES OF VIETNAM
3947
Views & Citations2947
Likes & Shares
This study uses exploratory factor analysis (EFA) and positive factor analysis (CFA) to test the customer satisfaction scale for beauty services at cosmetology facilities. The study has determined a scale of influencing factors including 6 components with 31 observed variables. The results of the study have clarified the factors affecting customer satisfaction with cosmetic facilities. At the same time, providing a theoretical model of customer satisfaction scale at beauty facilities. Because, economic life is increasingly improving, the need of people for using services is increasing. Besides working time, they always want to rest and relax to find the balance in life. Therefore, the aesthetic, body care facilities were born to meet the increasing needs of people. For beauty establishments, their business orientation is shifting to the individual customer segment, along with the business of beauty products. With this audience, their satisfaction will determine the behavior of buying and using services. The study of customer satisfaction with cosmetic services will help business subjects to build customers’ trust, build relationships and reputation with customers. From there, help improve operational efficiency at the cosmetology.
Keywords: Beauty services, Customer satisfaction, Beauty service quality, EFA discovery factor analysis, CFA affirmative factor analysis.
In this era, equal business mechanisms have created conditions and vast playground for businesses. But open opportunities are always associated with difficulties and challenges. That is the business, business establishments face increasing competition (Aghazadeh, 2015). Therefore, the problem for them is how to improve the quality of services, because this is the decisive factor and the most effective solution to improve the competitiveness of beauty facilities. institute. In addition, customer satisfaction is always a top concern for survival and development, to be able to satisfy current customer needs and attract new customers. Since then, it requires the aesthetic facility besides improving the service quality to constantly understand consumer trends as well as the needs of customers (Arkush, 2012; Bateson, 1991; Cadotte, Woodruff & Jenkins, 1987). By doing so, they will improve service quality, provide new services as well as overcome existing shortcomings and shortcomings to improve business efficiency.
Satisfaction or satisfaction of customers with beauty services in cosmetology is a feeling state of being compared to their expectations when consuming products and services here (Tushnet, 2014; Srivastava, Fahey & Christensen, 2014). For customers, they are often concerned with the quality of service, price as well as the attitude of the salon.
Beauty services (also known as beauty care) can be understood as beauty care and improvement activities through the use of equipment, technological machinery, products, cosmetics,... It will meet customers' aesthetic needs. That will bring people physical health and mental relaxation. Previously, beauty care (spa, surgery and cosmetic dentistry) was considered a luxury service for women and the upper class. However, the development of technology and the increasing demand for beauty have made Vietnamese people’s perception of aesthetics increasingly changing (Mankiw, 2005). Beauty reconditioning has gradually become one of the top choices to help everyone, regardless of age or gender, feel more confident and successful in life. In addition, spa services such as skin care and massage are being used by many customers for the purpose of relaxing and restoring energy after stressful working hours (Levesque, Gordon & McDougall, 1996). Beauty care is one of the needs in human life, it contributes to improving life, helping people to be confident in the process of communication and happiness in life.
Based on the research model of Gronroos (1984), in 1985, Parasuraman built SERVQUAL mixed measurement tool, used to measure perceived service quality (Krešić, Herceg, Lelas & Jambrak, 2010). This scale consists of 22 variables to separately measure customers' expectations and realistic perceptions of service quality (Burhan, 2020; Ralph, 1984). Accordingly, the quality of service is determined to include the level of perception after eliminating the expected values. This is one of the most commonly used models to evaluate service quality in many different areas (Lugosi, 2006; Anderson, 1998). The SERVQUAL variant model consists of 10 components: (1) Tangible media (2) Reliable (3) Responsive (4) Service capacity (5) Accessibility (6) Grace (7) Information (8) Trust (9) Safety (10) Understanding.
Based on the previous studies, based on the actual service business in the northern region of Vietnam, the author has proposed a model of 6 hypothetical components (Bolton & Drew, 1991). The model is built as follows:
H1: Service quality has a significant direct impact on customer satisfaction. In the past, price competition was the most important factor for businesses. In this day and age, price is no longer a unique element, a vital element in the competitiveness of service businesses, that position has given way to the quality of service and product. With the same types of products, the quality of products and services that are good, meeting the requirements, customers are ready to buy at a high price. If the quality of products and services is not guaranteed, businesses will lose customers, have no revenue and easily lead to the risk of bankruptcy. Therefore, when the salon's service quality on service is assessed by customers, the level of customer satisfaction will increase and vice versa.
H2: Service prices affect customers' choice of services. When the price of the service is suitable and competitive with other cosmetic facilities, customers will choose and use the service.
H3: Service attitude has a significant direct impact on customer satisfaction, as the customer service attitude about beauty services increases, the customer satisfaction level will increase and vice versa.
H4: Trust has a significant direct impact on customer satisfaction, when the reliability of the beauty services rated by customers increases, the level of customer satisfaction will increase and vice versa.
H5: Satisfaction has a significant direct impact on customer satisfaction, as the level of customer service appreciation increases, the customer satisfaction level increases and vice versa.
H6: Tangible facilities have a significant direct impact on customer satisfaction, when salon's tangible facilities are appreciated by customers, their customer satisfaction level will increase and vice versa.
RESEARCH METHODS
The scale
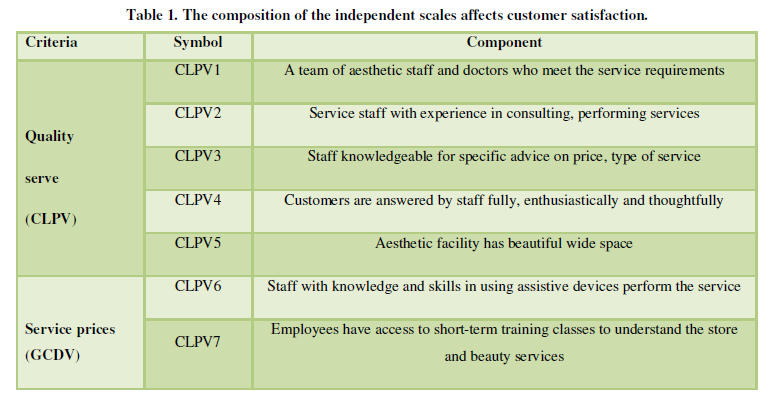
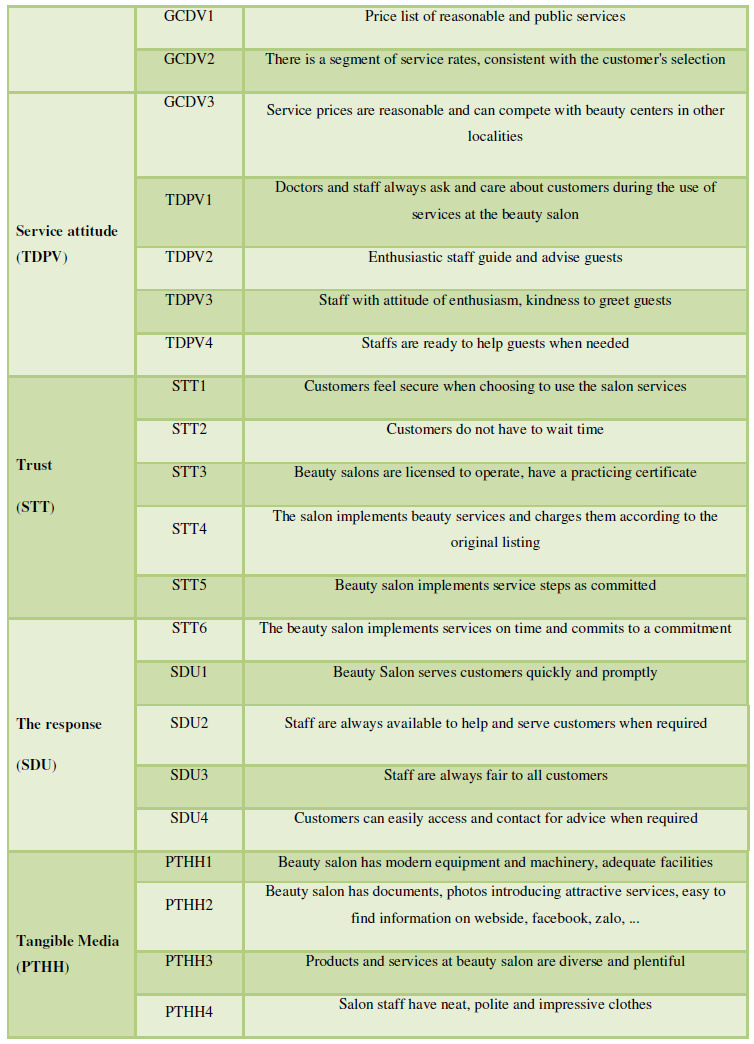
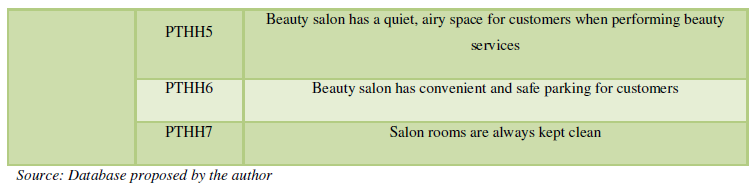
To assess customer satisfaction with beauty services, a research model with 6 components: (1) Trust: 6 variables; (2) Response: 4 variables; (3) Service capacity: 7 variables; (4) Service attitude: 4 variables; (5) Tangible media: 7 variables; (6) Price: 3 variables. The scale of service quality in this study includes 31 variables built on the SERVQUAL scale (Parasuraman, 1988).
Specific observed variables are measured on a 5-level Likert scale used to rank from small to large (Spreng & Page, 2003; Dooley & Forfas, 2009; Mano & Oliver, 1993), with the larger the number the higher the satisfaction level (1-Very dissatisfied; 2-Dissatisfied; 3-Neutral; 4-Satisfied; 5-Very satisfied). In addition to the above scales, the study also uses additional identification and hierarchical scales to screen the interviewees and collect personal information of the interviewees such as: Gender, income, occupation (Bilgili, Erciş & Ünal, 2011; Bhattacherjee, 2001) (Table 1).
METHODS OF ANALYSIS
The paper uses survey survey method, uses standardized form of questions and sets of answer options in the questionnaire (Hang, Dat, Huan & Phuong, 2020; John & Martínez, 2000). The objective of this study is to provide specific data, so that decision makers can accurately predict the relationship between the factors to be studied and have a more comprehensive view of the research problem (Dunning & Lundan, 2008; Spreng, MacKenzie & Olshavsky, 1996). To accomplish this goal, the thesis applies a direct research method through a customer satisfaction model when using services at cosmetology facilities through a processing survey on SPSS software. The survey was conducted with 200 questionnaires issued to investigate (Porter, 2003; Barney, 1991). After collecting, eliminating unsatisfactory questionnaires, the remaining research sample put into analysis is 160 votes.
After the survey results, the research has used quantitative analysis methods to verify the reliability of the built scale with Cronbach Alpha coefficient (Johansson, Douglas & Nonaka, 1985). Next, meaningful observations and achieving reliability in line with theoretical requirements will continue to be included in the EFA analysis for a preliminary assessment based on methods such as descriptive statistics, reliability testing. reliability of the scale, analysis of discovery factors. Subsequent analysis will assess the relevance of the model to the research data through the CFA step (Lee, Song & Yee, 2000). This step will determine the relationship between observed variables and reality. Based on the research results, the thesis proposes a number of key solutions to improve customer satisfaction.
ANALYSIS RESULTS
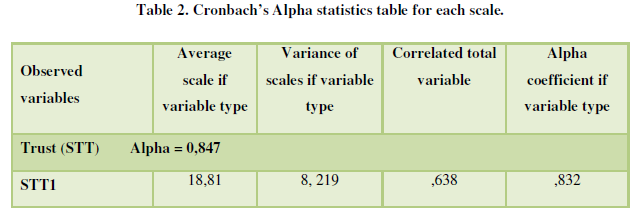
Assess the Reliability of the Scale with Cronbach's Alpha Coefficient
Factors affecting customer satisfaction are measured by 6 components. A total of 31 observed variables were used. Cronbach's Alpha results show that all components of the scale have good and high reliability coefficient (greater than 0.5) (Table 2).
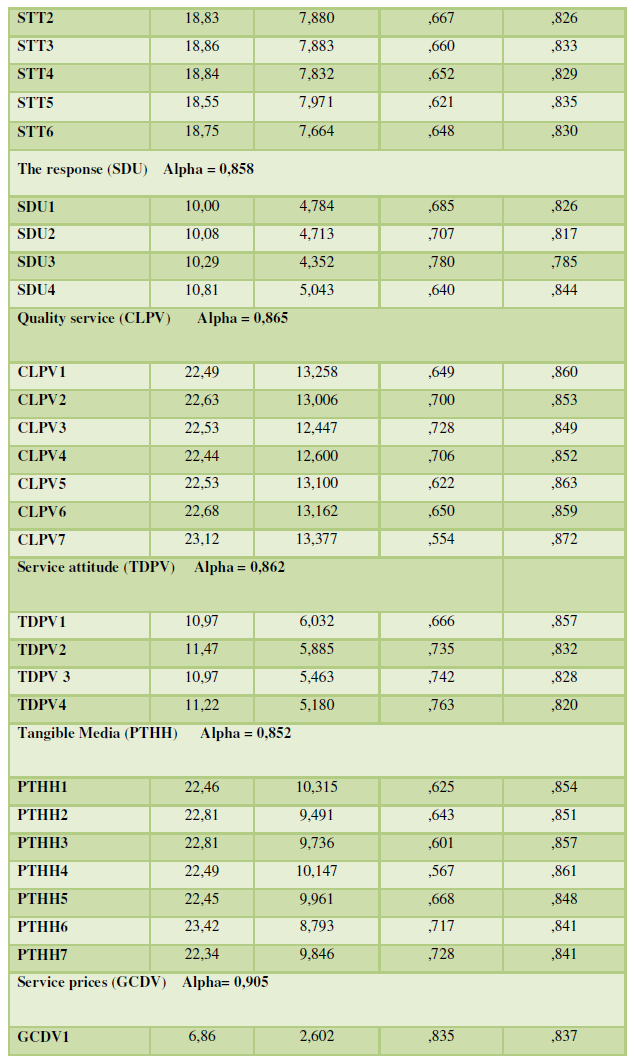
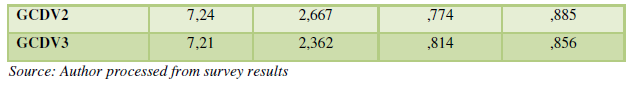
Evaluation of the component scale “Service prices”
Cronbach’s Alpha is priced at 0.905 (>0.6). The correlation coefficients (Corrected Item-Total Correlation) of the variables measuring this component are greater than the allowed standard (>0.3). In addition, the Alpha coefficients when the variable type (Cronbach’s Alpha if Item Deleted) of the variables are smaller than the Cronbach’s Alpha coefficient. Therefore, all variables are used in the next EFA discovery factor analysis.
Evaluation of the component scale of “service quality”
Ingredients Quality of service with Cronbach’s Alpha is 0.865 (>0.6). The correlation coefficients (Corrected Item-Total Correlation) of the variables measuring this component are greater than the allowed standard (>0.3). Besides, the Alpha coefficients when the variable type (Cronbach’s Alpha if Item Deleted) of the variables are smaller than the Cronbach’s Alpha coefficient. Therefore, all variables are used in the next EFA discovery factor analysis.
Evaluation of the component scale “Service attitude”
The sympathetic component has Cronbach’s Alpha which is 0.862 (>0.6). The correlation coefficients (Corrected Item-Total Correlation) of the variables measuring this component are greater than the allowed standard (>0.3). Besides, the Alpha coefficients when the variable type (Cronbach’s Alpha if Item Deleted) of the variables are smaller than the Cronbach’s Alpha coefficient. Therefore, all variables are used in the next EFA discovery factor analysis.
Evaluating the component scale of “Trust”
The ingredient of trust with Cronbach’s Alpha is 0.847 (>0.6). The correlation coefficients (Corrected Item-Total Correlation) of the variables measuring this component are greater than the allowed standard (>0.3). Besides, the Alpha coefficients when the variable type (Cronbach’s Alpha if Item Deleted) of the variables are smaller than the Cronbach’s Alpha coefficient. Therefore, all variables are used in the next EFA discovery factor analysis.
Evaluation of the component scale “Response”
The observed variables in this factor are not appreciated by customers, especially the variable SDU4- Cronbach’s Alpha is 0.844.
Evaluation of the component scale “Tangible medium”
The tangible media component with Cronbach’s Alpha is 0.852 (>0.6). The correlation coefficients (Corrected Item-Total Correlation) of the variables measuring this component are greater than the allowed standard (>0.3). The coefficients of Alpha when the variable type (Cronbach’s Alpha if Item Deleted) of the variables are smaller than the Cronbach’s Alpha coefficient. Therefore, all variables are used in the next EFA discovery factor analysis.
Analysis of Efa Discovery Factor and Cfa Confirmatory Factor
After evaluating the variables and the scales of the variables in accordance with the model and data of the research by analyzing alpha reliability coefficient, we conduct EFA discovery factor analysis to further eliminate. Get out of the model. Using this method, we use them to shorten a set of mutually interdependent variables into a smaller set so that they are more meaningful to still contain most of the information of the original set (Kazemi, Belenj & Dolatabadi, 2012).
Therefore, the research model must satisfy certain conditions. KMO coefficients should be in the range of 0.5 to 1 and the significance of the model according to Bartlett must be statistically significant at 5%. Variables with a weight less than 0.5 in EFA will be excluded from the research model. And there is a method of extracting the coefficients used as principal components with varimax rotation and stopping points when extracting elements with eigenvalue =1. The scale is acceptable when the total variance is equal to or greater than 50% and the factor weight is 0.5 or more(Table3).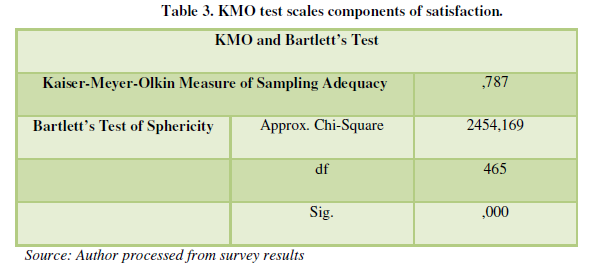
The results of the first factor analysis for the specific scales are as follows: The Chi-square statistical results of the Barlett’s test (Approx. Chi-Square) reached 2454,169 with significant levels. sig = 0.000 (<0.05) and KMO coefficient = 0.787 (0.5<KMO<1) so the observed variables are correlated with each other in the overall scope so EFA is consistent with the research data. assist. The extracted variance is 65,305% (>50%) showing that the extracted factors explain 65,305% of the data variability; 6 extracted elements have an Eigenvalues value = 2,087 (>1). Observed variables with factor factors (Factor loading) meet the requirements of 0.5 or more (Jamal & Naser, 2002). The EFA analysis is completed because it has reached statistical reliability (Table 4).
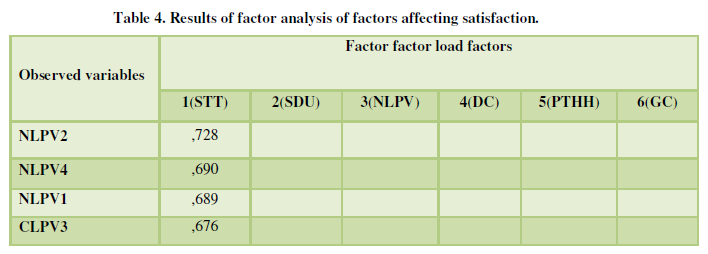
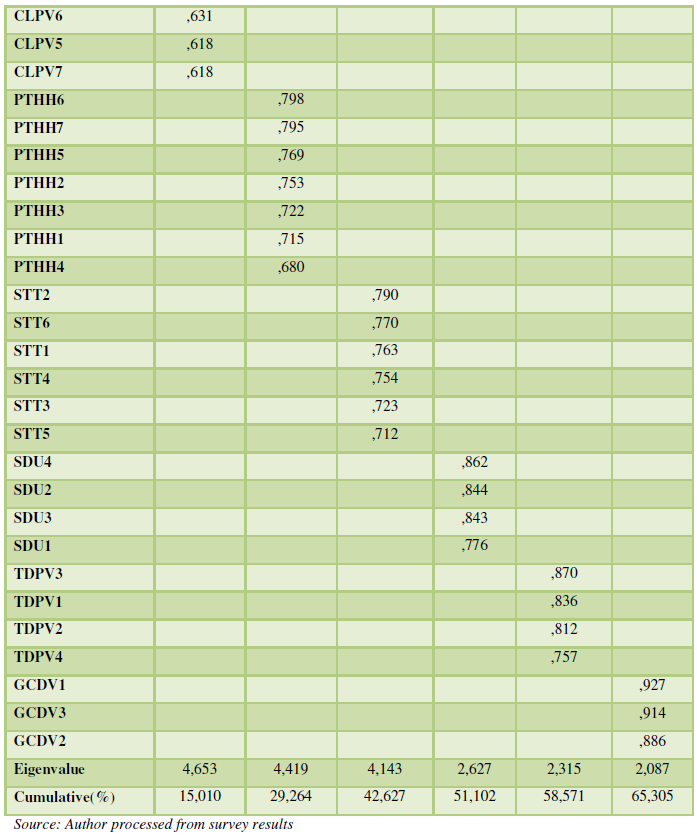
Thus, the customer satisfaction model consists of 6 initial components, after analyzing the factor of discovering EFA, there are still 6 factors with 31 observed variables. The measurement of each factor remains the same, so a verification of Cronbach’s Alpha reliability is not necessary (because there is no change).
Trust: According to the descriptive statistics, the level of customer evaluation of the observed variables according to the average value is relatively high (Mean <3.7; greater than the middle of the scale but lower than point 4 = Harmonized hearts). According to the distance value presented in chapter 2, it is said that customers rate this fillet at “Satisfaction” (Mean is in the range of 3.41-4.2).
Customer evaluation results for each observed variable are shown in the table above (Koch, 1985). It can be noticed that there is no long distance in the level of evaluation among the variables, in which the highest is STC6 (Mean = 3.84) near the satisfaction score 4, the number of customers who think “Satisfied” about this variable is 102 (accounting for 66.7%); the lowest is STC3 (Mean = 3.73) but still in the range of satisfaction values.
Response: The observed variables in this factor are not appreciated by customers, especially the SDU4 variable - You can easily see your treating doctor when the request has a Mean value below 3, namely Mean = 2.92, according to the distance value, this value is in the range of 2.61-3.40, that is, the level “Concern”. The TC4 variable has 50% of customers rated at 3 (79 people) and 22.7% of customers rated at 2 as “Not satisfied” (41 people); The most appreciated variable in the Response factor is SDU1-The salon staff serves you quickly and promptly with a value of Mean=3.73 close to the rating 4-Satisfied with 82 customers. The evaluation was satisfied (accounting for 52.6%). This shows that customers are almost satisfied with the quick service of the staff, but the salon also needs to pay more attention to the issue of customers who want to see the treating doctor to make them more satisfied. fastidious customer.
Quality of service: In this factor, the observed variables are evaluated on the level of 3-Stray and near 4-Satisfaction. Especially, CLPV4 and CLPV1 have the highest rating: With CLPV4, the value of Mean=3.97 can be said that customers are satisfied with the right service with customer requirements of staff, with 75 “Satisfied” customers. (accounting for 48.7%), 40 customers were completely satisfied (accounting for 26%); As for CLPV1, the value of Mean=3.91 is near the point of 4 with 65% of satisfied customers (97 people), this shows that the staff of beauty salon staff are professional and professional. The goods are relatively high and satisfied.
However, aesthetic establishments should train, confer the qualifications and skills of the staff more to keep the credibility, prestige, create trust and satisfaction for many customers.
Service attitude: The level of customer assessment by the average value is well above the midpoint of 3 but no observed variables were rated as truly satisfactory by the customer at point 4. Overall, the salon has not really created. Empathy, much attention to customers. The lowest is the variable DC2-The questions and concerns of the salon are fully answered, obviously with an average value of 3.41 with 16 dissatisfied customers accounting for 8.6% and 68 customers rated the “Confidence” at 41.3%, this number is not small, this shows that the customer's questions have not been satisfactorily answered with their expectations. In order to better connect the salon to the customer, the salon needs a regime, policy, reasonable cost .. on special occasions to express gratitude to customers, but as the result above, that customer not yet rated as “Satisfied” but only relatively.
Tangible media: In terms of tangible salon equipment, all measurement variables are above the 3 point level, but the PTHH 6 variable is priced at Mean=3.05, customers are confused about this factor, the customer’s parking space. When customers came to cosmetology, they were not satisfied, there were 30 customers rated the score of 2-Dissatisfied (accounting for 19.8%) and 75 passengers rated the score of 3-Confused (accounting for 47.7%), the highest rated score is 4-satisfied and level 5-Completely satisfied with no customer reviews. This shows that the salon needs to pay more attention to customer parking to make customers really satisfied in all aspects of tangible vehicles. The observed variables are appreciated as PTHH7-The salon room is always kept clean, PTHH5-The salon has a quiet environment for customers to rest and treat, PTHH1-Salon has equipment equipment and modern machinery, adequate facilities with average values are from the score of 4-Satisfaction, namely: PTHH7 is 4.12; PTHH5 is 4.01; PTHH1 is 4.00.
Service prices: The observed variables in this factor are evaluated on the level of “Confusing” but not yet reached “Satisfaction”. The most valued variable on price is GC1-The price list of reasonable services has a Mean value of 3.79 with 85 customers (out of 157) rated as “Satisfied” accounting for 55.1 % and 26 customers feel “Completely satisfied” accounted for 17.8%. The GC3 variable on the ability to compete with beauty centers has not yet achieved the score of 4-Satisfaction: Only 75 customers out of 157 feel satisfied, accounting for 46.8%. Beauty salons need to consider the price of services to increase competition with other beauty centers in the region.
CONCLUSIONS
Based on a study of customer satisfaction, finding out the factors affecting customer satisfaction with services at cosmetology facilities, this study provides a measurement model of Customer satisfaction with the service.
Official research through questionnaires interviewing customers who have used the services at beauty salons with sample sizes of 200 survey forms to test the scale. The scale was verified through Cronbach’s Alpha reliability analysis and EFA discovery factor analysis. Customer satisfaction is assessed on a Likert 5 scale through descriptive statistics. The analysis results show that after addition and adjustment of the scales are allowed to be trusted. Customer satisfaction with services at cosmetology facilities consists of 6 factors (components): (1), Trust: measured by 6 observed variables; (2) Responsiveness: Measured by 4 observed variables; (3) Quality of service: Measured by 7 variables; (4) Service attitude: Measured by 4 variables; (5) Tangible media: Measured by 7 variables; (6) Price: Measured by 3 observed variables. These are the scales that show the level of impact on customer satisfaction when coming to beauty salon.
Thus, along with the increasingly strong competition in the current market economy, the study of customer satisfaction when using beauty services at cosmetic establishments and influencing factors to the satisfaction of customers when using the services here is essential and of particular importance. Thereby, they will evaluate the ability to meet the expected values of customers, identify the areas that have been done, the limitations and more importantly, identify the factors that need to be improved in time Come to further improve the level of customer satisfaction to compete with other beauty centers in the study area in the field of beauty services. Therefore, this will be a useful reference for businesses operating in the field of beauty services, helping them have an overall view in improving the quality of services to target customers to attract. they are increasingly crowded, raising the value of trust, thereby helping businesses achieve the goal of maximizing profits in the context of increasingly fierce competition today.
Aghazadeh, H. (2015). Strategic marketing management: Achieving superior business performance through intelligent marketing strategy. Procedia - Social and Behavioral Sciences 207(Supplement C), 125-134.
Arkush, D. (2012). Democracy and Administrative Legitimacy. Wake Forest Law Review 47, 611-630.
Anderson, G. (1998). Data Analysis and Forecasting in Business. Journal Academy of Science in London 23, 28-41.
Barney, J. (1991). Firm Resources and Sustained Competitive. Journal of Management 17(1), 99-120.
Bateson, J.E.G. (1991). The AMA Handbook of Marketing for the Service Industries, New York: American Management Association, pp: 135-150.
Bhattacherjee, A. (2001). An empirical analysis of the antecedents of electronic commerce service continuance. Decision Support Systems 32(2), 201-214.
Bolton, R.N., & Drew, J.H. (1991). A Multistage Model of Customers’ Assessments of Service Quality and Value. Journal of Consumer Research, 17(4): 375-384.
Bilgili, B., Erciş, A., & Ünal, S. (2011). Kano model application in new product development and customer satisfaction (adaptation of traditional art of tile making to jewelries). Procedia Social and Behavioral Sciences 24(2011), 829-846.
Burhan, M.A.A. (2020). Green marketing and its impact on consumer purchasing behavior and the tourism sector/an analytical study - The jordanian green market. Journal of Economics, Business and Market Research 1(1), 8-24.
Cadotte, E.R., Woodruff, R.B. & Jenkins, R.L. (1987). Expectations and Norms in Models of Consumer Satisfaction. Journal of Marketing Research 24(3): 305-314.
Dooley, J. & Forfas. (2009). Sustaining Investment in Research and Development, Advisory Council for Science Technology and Innovation. Journal of Research in Humanities and Social Science 4(6), 2016.
Dunning, J.H. & Lundan, S. (2008). Institutions and the OLI paradigm of the multinational enterprise. Asia Pacific Journal of Management (25), 537-593.
Hang, N.T., Dat, P.M., Huan, N.V. & Phuong, T.T.V. (2020). Inspection of the level of effects of service quality to customer satisfaction in retail supermarkets. SIASAT Journal of Social 4(1), 36-46.
Johansson, J.K., Douglas, S.P. & Nonaka, I. (1985). Assessing the impact of country of origin on product evaluations: A new methodological perspective. Journal of Marketing Research 22, 388-396.
John, O.P. & Martínez, V.B. (2000). Handbook of research methods in social and personality psychology. New York, NY, US: Cambridge University Press, pp: 339369.
Jamal, A. & Naser, K. (2002). Customer satisfaction and retail banking: An assessment of some of the key antecedents of customer satisfaction in retail banking. International Journal of Bank Marketing, 20(4), 146-160.
Koch, Jr. C.H. (1985). Judicial Review of Administrative Discretion. 54 George Washington Law Review, pp: 469-511.
Kazemi, A., Belenj, A. & Dolatabadi, H.R. (2012). Evaluation of the effective factors on customers’ satisfaction Using INDSAT Model; Case Study: Household appliances’ customers of mobarakeh steel company. International Journal of Academic Research in Business and Social Sciences 2(12), 150-160.
Krešić, G., Herceg, Z., Lelas, V. & Jambrak, A.R. (2010). Consumers’ behaviour and motives for selection of dairy beverages in Kvarner region: A pilot study. Mljekarstvo Magazines 60(1), 50-58.
Lugosi, C.I. (2006). Rule by Law v. Rule of Law. Issues in Law and Medicine 22, 234-243.
Lee, M.J., Song, H.K. & Yee, S. (2000). Study on Classification of Forest Vegetation of Songinbong and Taeharyong in Ullungdo - With a Special Reference to TWINSPAN and Phytosociological Method. Korean Journal of Environment and Ecology 14(1), 57-66.
Levesque,T., Gordon H.G. & McDougall, G.H.G. (1996). Determinants of customer satisfaction in retail banking. International Journal of Bank Marketing 14(7), 12-20.
Mankiw, N.G. (2005). Commentary: Separating the business cycle from other economic fluctuations, Proceedings - Economic Policy Symposium - Jackson Hole, Federal Reserve Bank of Kansas City, pp: 187-192.
Mano, H. & Oliver, R. (1993). Assessing the dimensionality and structure of the consumption experience: Evaluation, feeling and satisfaction. Journal of Consumer Research 20(3), 451-466.
Porter, M.E. (2003) The economic performance of regions. Regional Studies 37(6/7), 549-578.
Ralph, L.D. (1984). Modeling choices among alternative responses to dissatisfaction. Advances in Consumer Research 11. Ed. William D. Perreault. Atlanta, GA: Association for Consumer Research, pp: 496-499.
Srivastava, R.K., Fahey, L. & Christensen, H.K. (2014). The resource based view and marketing: The role of market-based assets in gaining competitive advantage. Journal of Management, 777-802.
Spreng, R.A. & Page, T.J. (2003). A test of alternative measures of disconfirmation. Decision Sciences 34(1), 31-62.
Spreng, R.A., MacKenzie, S.B. & Olshavsky, R.W. (1996). A Reexamination of the Determinants of Consumer Satisfaction. Journal of Marketing 60, 15-32.
Tushnet, M. (2014). Rule by Law or Rule of Law. Asia Pacific Law Review 22, 79-92.
-
 Table 1
 -
Table 2
-
Table 3
-
Table 4
-
Table 5
-
Table 6
-
Table 7
-
Table 8
-
Table 9


