Review Article
Treatment of Vegetable Oil Refinery Wastewater Using Response Surface Methodology
1420
Views & Citations420
Likes & Shares
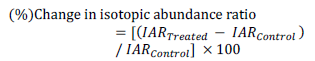
Nowadays, wastewater from vegetable oil refining (VORW) heavily loaded with fats, oils, phenol, etc. presents serious problems for the environment. Indeed, in order to minimize the impacts on the receiving environment (surface water, groundwater, etc.), the treatment of these discharges becomes mandatory. Currently, several techniques are widely used to control the pollution from these discharges. The present work aims to study the efficiency of the flocculation-coagulation process using Ferric chloride (FeCl3) as a coagulant coupled with a cationic polymer (polyacrylamide) as a flocculant for the treatment of these wastes. The surface methodology response (RSM) was used to study the effects of the main factors that influence the process and their interactions. The optimal conditions obtained during the study were 1.3g /L of coagulant (FeCl3) and 8.6 mg / L of flocculant at pH round 6.4. The results obtained while respecting the optimal conditions showed a reduction of 90% of COD (Chemical oxygen demand) and 95% of turbidity and oils and fats. The analysis of variance showed a high coefficient of variance (R) values of 0.91 for COD and 0.80 for turbidity, oil, and grease removal, respectively. Thus, ensuring an adjustment satisfactory second-order regression model with experimental data. Using the experimental design, this statistical methodology allows achieving optimal conditions very close to the experimental ones. It constitutes a suitable approach for optimizing the coagulation-flocculation process by experiment confirmation. Thus, the coagulation method developed in the present work can be considered useful for the pretreatment process of vegetable oil refinery wastewater prior to biological treatment.
Keywords: Oil, Refinery, Wastewater, Treatment, Optimization
INTRODUCTION
The industrial units of vegetable oil refineries are large consumers of water and, therefore large producers of wastewater heavily loaded with pollutants [1]. These wastewaters have high chemical oxygen demand (COD), oil &grease (O&G) levels, along with elevated dissolved solid concentrations [2,3]. Furthermore, their transport presents a high risk of clogging in pumps and piping. The waste streams that come out of vegetable oil refineries create serious environmental problems such as a significant threat to aquatic life due to its high organic content [4]. For these reasons, vegetable oil refinery wastewater (VORW)cannot be treated in a conventional municipal wastewater treatment plant. Hence, its treatment is crucial before the disposal step. This has driven many researchers towards developing suitable treatment technologies by using oil in water mixture to produce treated water of appropriate quality for reuse and recycling [5,6].
The characteristics of wastewater depend mainly on the type of oil processed as well as on the process applied. Different processes have been described in the literature for the treatment of wastewaters with high oil and grease content. In fact, the commonly used are chemical destabilization [3], membrane processes [7,8] and electrochemical methods [1]. The process of flotation for treating oily wastewaters was also already examined [9,10]. Chemical unit processes have been found to be also cost-effective, easy to handle and can be considered as an alternative treatment for energy saving. This process may be used as a pre-treatment step prior to biological treatment to improve the biodegradability of the wastewater during the biological treatment. The iron (III) chloride hexahydrate, FeCl3·6H2O, is a widely used coagulant. It has been widely used to treat oily wastewater [11,12]. Many factors can affect the efficiency of chemical treatment including the type and dosage of coagulant/flocculant [13], pH [14], mixing speed and time [15], temperature and retention time [16], etc. Due to the complexity of the optimization process, it would be better and less consuming to find the optimum value with highest efficiency by gathering all these factors. Since then, many experiments should be realized to reach this optimum: one factor is varied while all the others are kept fixed from one test to another at specific conditions. This optimization is usually time consuming concerning the exact value of the optimum due to the interactions between the varied factors that are ignored. In order to have a better optimization, experimental design and Response Surface Methodology (RSM) have been proposed to define the influence of individual factors, their interactions, and the isoresponses curves for each response. RSM is an efficient tool for Process Optimization; it's a multivariate statistical technique used to optimize processes. With RSM, a limited number of experiments are enough to determine which factors are influencing the process's most efficiently. There are different fields where RSM gets used, including the preparation of activated carbons from Argan shells [17], the preparation of chitosan from beet molasses, and the synthesis of N-carboxy butyl chitosan [18]. Therefore, for optimizing specific processes in the food industry, pharmaceuticals industry, material manufacturing, biotechnology [19-21], and environmental science [22], this method has been widely approved and efficient. In this context, the aim of this work is is to optimize the coagulation-flocculation process for the wastewater treatment of a Moroccan agro-industrial company. In the first stage, a Central Composite Design (CCD) was used to study the effect and first-order interactions of various factors (coagulant dosage, flocculant dosage and pH) on the coagulation-flocculation process, and, in the second stage, those factors are optimized using RSM and multicriteria optimization with the desirability function.
MATERIALS AND METHODS
Wastewater samples
The wastewater samples used in this study were obtained from the discharge of a Vegetable Oil Refinery located in Casablanca (Morocco). Upon collecting the samples, their physicochemical characteristics were investigated to measure their level of pollution and to select the appropriate treatment. The samples were collected in glass bottles and kept in a refrigerator during experimentation. Chemical characterizations were performed by defining the following parameters: the aqueous phase pH, the temperature, the turbidity, the oil and grease amount, and the chemical oxygen demand (COD). The turbidity was determined by using turbidity meter (HI 93703 Microprocessor turbidity meter). The concentration of emulsified oil was determined by the extraction colorimetric technique. Hexane was used as a solvent to extract the oil from the oil in water emulsion [23]. The COD was determined using Open Reflux Method (5220-B). Most types of organic matter are oxidized by a boiling mixture of chromic and sulfuric acids. A sample is refluxed in a strongly acid solution with a known excess potassium dichromate (K2Cr2O7). After digestion, the remaining unreduced K2Cr2O7 is titrated with ferrous ammonium sulfate to determine the amount of K2Cr2O7 consumed, and the oxidizable matter is calculated in terms of oxygen equivalent the 2-hour time is adopted for the oxidation of organic matter under standard conditions. Some samples with very low COD or with highly heterogeneous solids content may need to be analyzed in replicate to yield the most reliable data. Mohr's salt determined the excess dichromate K2Cr2O7. Other physicochemical parameters (BOD, TSS….) for wastewater characterization measurement were performed according to standard methods [24].
Coagulation-flocculation experiments
The coagulation-flocculation experiments were carried out using the jar test method in 500 mL beakers. After the coagulant was added with a varying dosage from 582 to 1872 mg/L, the solution pH was adjusted to 4.32 and 7.68 by adding 0.1 M hydrochloric acid or 0.1 M sodium hydroxide solutions. The sample was directly agitated at a constant speed of 200 rpm for 2 min. Then, the flocculant was added with a dosage varying from 1.04 to 11.96 mg/L followed by a slow stirring at 40 rpm for 40 min; thereafter, a settlement for 60 min was performed. After that, samples were taken from the water level around 2 cm underneath the surface to measure the physicochemical parameters of the supernatant.
Experimental design and data analysis
The central composite design (CCD), with five replicates at the central points, was employed to fit a second-order polynomial model and obtain the experimental error. The CCD was applied with three design factors and five levels. The factors are the pH (X1), the flocculant dosage (X2) and the coagulant dosage (X3). The coded levels and the natural values of the factors set in this statistical experiment are shown in Table 1. The central values chosen for the experimental design were as follows: Coagulant dosage, 1200 mg/L; flocculant dosage, 6.5mg/L; and pH 6. The value of α for rotatability depends on the number of points in the factorial portion of the design, which is given in Equation (1):
Where NF is the number of points in the cube portion of the design (NF = 2k, k is the number of factors). Since, there are three factors, the NF number is equal to 23 (=8) points, while α is equal to (8)1/4 (=1.682) according to Equation (1). (Table 1)

COD, Turbidity and Oil & Grease removal percentage were selected as the dependent variables. The response variable was fitted by a second-order model in the form of quadratic polynomial equation (2):

Y is the response variable to be modeled; Xi, and Xj the independent variables that influence Y; b0 is the constant term, bᵢ represent the coefficients of the linear parameters (principal effect), bᵢj the ijth interaction coefficient and bᵢᵢ the quadratic coefficient. The actual design used in this work is presented in Table 2.
Analysis of variances (ANOVA) was used to analyze the data to obtain the interaction between the process variables and the responses. The correlation coefficient expressed the quality of the fit polynomial model, and its statistical significance was checked by the F-test. Model terms were selected or rejected based on the P-value (probability) with a 99% confidence level. Three-dimensional plots and their respective contour plots were obtained based on the effects of the levels of two factors. The analysis of the results of each response was achieved by response surface methodology based on a second-order model adequate to predict responses all over the experimental regions. All the calculations (regression, statistical tests, and graphical plots) were performed with NemrodW software [25]. For experimental validation of results, two additional experiments were conducted, in the optimum conditions, to verify the validity of the statistical experimental strategies.
RESULTS AND DISCUSSION
Characterization of VORW
The physicochemical characterization of water samples plays a significant role in understanding the evolution of pollution levels during the time, identifying the nature and concentration of components, and controlling the CF process since the performance of the treatment is highly influenced by the chemical and organic loads. Therefore, two samples were taken each week for three months. Results of physicochemical characterization are summarized in Table 3. From obtained results, pH was ranged between 4.22 ± 0.17 and 1.5 ± 0.07; it remains acid during the study period, which may be due to the use of sulfuric acid in the deacidification step. The mean values of COD and BOD5 were about 37.7 and 2.9 g/L, respectively, and the COD/BOD5 ratio was around 12, so biological treatment cannot be adopted in this case.
For the turbidity and TSS, the mean values were about 600 NTU and 4594 mg/L, respectively, which indicates that the VORW contains a level of suspended solids responsible for BOD5 and COD. In the same way, VORW contains a large number of chemical pollutants such as oil & grease (2053 mg/L), phosphorus (556 mg/L), and sulfate (1080 mg/L). The characterization results were consistent with those found by other authors [26-28]. They also found that VORW is highly charged with organic and chemical loads. Generally, the composition of wastewater from the effluent varies widely from day to another day. These fluctuations may be attributed to different types of oils processed and to operating conditions and processes [3]. Wastewater characteristics are not only influenced by the raw materials and the products processed but also by water used in washing procedures during and after production [29]. These factors influenced the observed variation in the COD and BOD5 values of each wastewater sample in conclusion, the physicochemical analysis revealed that almost all of the parameters indicating that the VORW is highly charged with organic and chemical pollutants and must be treated further before it can be discharged to any receiving water (Table 2).
Optimization of the coagulation/flocculation process Statistical analysis
Preliminary experiments were carried out to investigate the effect of the most influencing factors on CF treatment efficiency. The relationship between the three variables (coagulant concentration, flocculent dosage, and pH) and the three important process responses (COD, oil & grease and turbidity removal efficiencies) for the CF process was analyzed using RSM. Further experiments were carried out for the optimization process to obtain a quadratic model consisting of 15 trials with different combinations of the parameters plus five replicates at the center point choosing according to the Box–Behnken design as shown in Table 2. The statistical analysis of the Box–Behnken experimental results, response surface modeling, and optimization of process variables were carried out using NemrodW software (Table 3).
Significant model terms were desired to obtain a good fit in a particular model. The statistical analysis using NemrodW software allowed the development of mathematical equations, where predicted results (Y1, Y2, and Y3 for COD, Turbidity and oil & grease removals, respectively) were assessed as a function of pH (X1), flocculent dosage (X2), and coagulant concentration (X3) and calculated as the sum of a constant, three first-order effects (terms in X1, X2, and X3), three interaction effects (interactive terms in X1X2, X1X3, and X2X3) and three second-order effects (quadratic terms in X12, X22, and X32) according to Equation (2). The results obtained were then analyzed to assess the goodness of fit.
Central composite design (CCD) and fitted regression models as related to the pollutant removal
In the present work, the relationship between tree criteria of the pollutant removal (namely COD, turbidity, and oil & grease) and three controllable factors (namely coagulant concentration, flocculent dosage, and pH) was studied. By applying multiple regression analysis on the design matrix and the responses are given in Tables 4-6, the following second-order polynomial equations in coded form were established to visualize the effects of independent factors on the turbidity, oil & grease and COD removal efficiencies (Equations 3-5).

The model can describe the experimental response (Oil & grease removal):
In Equations. (3), (4), and (5), Y1, Y2 and Y3 correspond to responses of COD, turbidity, and oil & grease removals, respectively; X1, X2, and X3 correspond to independent variables of pH, flocculent dosage, and coagulant concentration, respectively. The positive sign of the coefficient indicates a synergistic effect and the negative sign indicates an antagonistic effect. The model equations and regression coefficients were significant (P < 0.01) and should be included in the model and illustrated that percentage removal of COD, turbidity, and oil & grease were related to all studied factors.
Statistical validation of the model was achieved with the Student’s statistical t-test for analysis of variance (NemrodW); it was used to determine the significance of the regression coefficients, and the p value was the indicator of the significance of the test. The more significant t and the smaller value of p, the model, and model terms are more statistically significant [30]. The analysis of variance is essential to test the significance of the model. Therefore, as seen in Tables 4, 5 and 6, the model was tested. We found that the quadratic models were highly significant from the low probability value (< 0.01).
The goodness of fit of the model was checked by determining the correlation between the theoretical and experimental responses (R2). In this case, the R2 value for Eq. (3) was 0.91 with a standard deviation of ε = 1.3, for Eq. (4) was 0.80 with a standard deviation of ε = 0.72, and for Eq. (5) was 0.80 with a standard deviation of ε = 1.10. Compared to other studies adopting RSM and Box–Behnken design statistical analysis to optimize industrial wastewater treatment [31,32], our models were considered highly significant. They showed excellent correlations between the experimental results and the predicted values of COD, turbidity, and oil & grease removal from these models.
Surface responses analysis
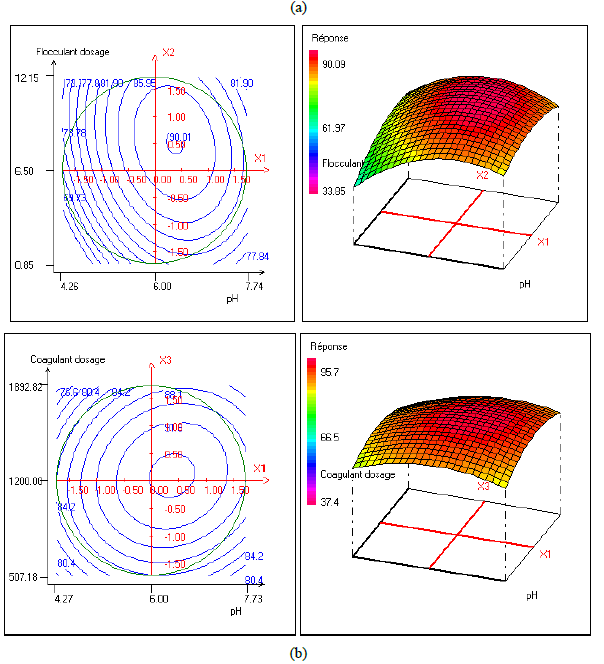
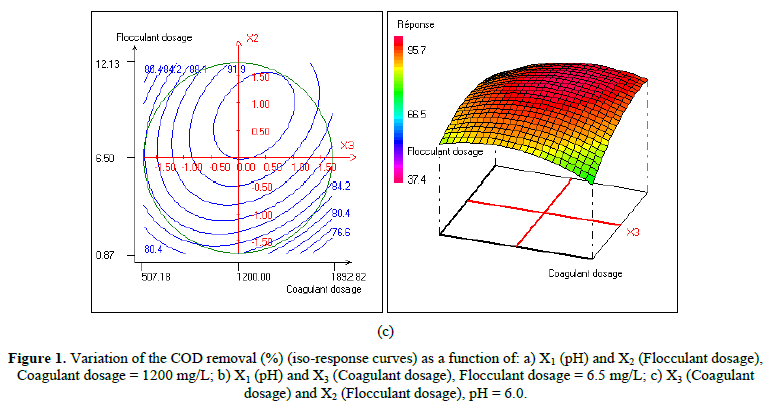
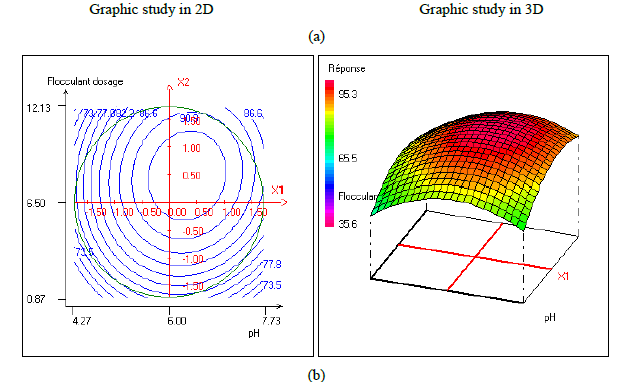
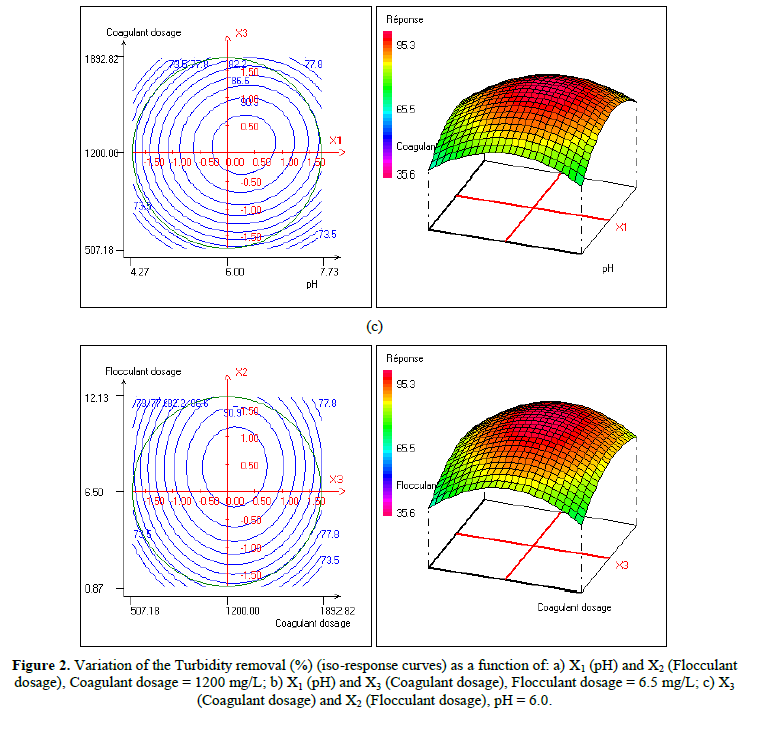
In order to provide better clarification of the effects of the independent variables and their interactions, two- (2D) and three-dimensional (3D) response surface plots were traced as a function of two factors at a time, carrying the other factor fixed at zero levels. Figure 1 shows the two-dimensional, and three-dimensional response surface plots for the COD removal from VORW treated using the CF process. As showed in the contour plots relating to the COD removal, the result revealed the high interaction between the factors tested; the trough in the response areas/surfaces showed that the optimal conditions for maximal COD removal were precisely inside the design limit. Hence, at fixed pH to 6, maximum COD removal percentages were achieved when coagulant concentration was ranged between 1.2 and 1.23 g/L. In contrast, the flocculent concentration was ranged from 7 to 7.8 mg/L. It was clear from the figures that the COD removal decreased when the pH of the wastewater was in the neutral field. From Figure 1(b), we can deduce that maximum COD removal was observed when flocculent concentration was fixed equal to 6.5 mg/L under coagulant concentration ranged from 1.1 to 1.3 g/L and pH ranged from 5.9 to 7.2. Contour plots of pH versus flocculent concentration at coagulant concentration fixed to 1.2 g/L presented in Figure 3(a) show that an interaction occurs between flocculent dosage and pH for oil & grease removal as a response; the maximum of oil & grease removal was attained when flocculent concentration ranged from 6.4 to 8.8 mg/L and pH ranged from 5.8 to 7. The following graphical representations, Figure 2 show the behavior of turbidity under the simultaneous change in two variables while fixing the other factor. As can be understood from the elliptical nature of contour plots of turbidity removal, there was a significant interactive effect between the three factors (coagulant concentration, flocculent concentration, and pH). From Figure 2(c), we can conclude that the optimal turbidity removal was observed when the coagulant concentration ranged from 1.2 to 1.4 g/L under flocculent concentration from 6.5 to 7.8 mg/L and pH equal to 6. On the other hand, the contour plots of coagulant concentration versus pH illustrated that the optimal conditions for maximal turbidity removal were achieved when coagulant dosage was ranged from 1.18 to 1.25 g/L and for pH values from 6 to 6.8 (Figure 2(b)). In Figure 2(a), contour plots showed that for coagulant concentration fixed at 1.2 g/L, turbidity decreased with the increase of flocculent concentration independently of pH. The maximum turbidity removal was obtained when pH values were between 6 and 6.8. The CF process efficiency to remove turbidity was highly influenced by the pH values of the treated samples can be concluded. Figure 3 shows the two-dimensional and three-dimensional response surface plots for the oil & grease removal. As showed in the contour plots corresponding to the oil & grease removal, the dome shape revealed the high interaction between the factors tested; the trough in the response areas/surfaces indicated that the optimal conditions for maximal oil & grease removal were inside the design limit. Thus, at fixed pH to 6, maximum COD removal was obtained when coagulant concentration was ranged between 1.1 and 1.3 g/L. In contrast, the flocculent concentration was ranged from 6.4 to 8.8 mg/L. It was clear from the Figure 3(a)that the removal of oil and grease decreased as the pH of the wastewater was in the neutral field. From Figure 3(b), we can deduce that maximum oil & grease removal was observed when flocculent concentration was fixed to 6.5 mg/L under coagulant concentration ranged from 1.1 to 1.3 g/L and pH ranged from 5.5 to 7.1. Contour plots of pH versus flocculent concentration at coagulant concentration fixed to 1.2 g/L presented in Figure 1(a) show that an interaction between flocculent dosage and pH for COD removal as a response; the maximum of COD removal was achieved when flocculent concentration ranged from 7 to 7.4 mg/L and pH ranged from 6.5 to 6.8. The 2D and 3D surface plots illustrated that the maximum turbidity and COD removals from VORW were obtained under pH six. The concentration of coagulant and flocculent proximate to zero. The optimum experimental conditions for COD, turbidity and oil & grease removals were achieved by solving the equations and by evaluating the response surface contour plots. The optimum values of the tested variables were as follows: coagulant concentration of 1.26 g/L, the flocculent concentration of 8.6 mg/L, and pH of 6.4, while the maximum of COD, turbidity, and oil & grease removals predicted were around 89.6, 95.3 and 95%, respectively. The models predicted for COD and turbidity removals were confirmed by carrying out the CF experiments at the optimal conditions predicted using RSM.

Desirability function
The desirability function is a method used for defining the best conditions for process adjustment, constructing possible simultaneous optimization of multiple responses. This being so, the best response conditions are attained simultaneously minimizing, maximizing, or seeking nominal values of specifications, depending on the best convenient situation for the process [33].
Each one of the responses (Y1, Y2...Yk) of the original set is changed, such that di belongs to interval 0≤di≤1. The di value increases when the ith response approaches the imposed limits.
Equation 6 is used to discover the D global index from a combination of each response processed through a geometric mean.

The maximum function D provides the best global compromise in the studied area and corresponds to optimal experimental conditions.
Rudimentary desirability functions with the minimum and objective values are illustrated in Figure 4, and the low and target value assigned to each objective and the partial desirability’s related to the three responses are shown in Table 7.


After calculating the NEMROD-W software, the response surface corresponding to global desirability function D is presented as a contour plot and a three-dimensional plot. The compromise domain is presented in Figure 5.

The optimal conditions corresponding to the maximum value of the desirability function (99.17%) are (pH=6.4, flocculant dosage=8.6 mg/L and Coagulant dosage=1267.3 mg/L). The response values calculated from the model for these experimental conditions are given in Table 8.
To approve the agreements of the results attained from the model and experiments. The values of responses are illustrated in Table 8 and compared with the values calculated by the model. The deviation between the experiment and the predicted values is inferior to 2%, pointing out the good precision of the model. The results presented in Table 8 confirmed that the experimental testing in the optimum conditions was in good agreement with RSM results.
CONCLUSIONS
The waste streams which come out of vegetable oil refinery without any treatment create environmental problem such as threat to aquatic life due to their high organic content. The treatment of wastewater laden with fatty oils has become a necessity in order to reduce pollution considerably. The physicochemical process by coagulation-flocculation appears to be very interesting for producing water that meets the quality standards of the water used for irrigation.
The present study concerns applying the experimental plan to determine the optimal conditions for the treatment of these discharges by coagulation flocculation to reduce pollution. RSM using CCD was applied to assess the effects of coagulant, flocculant, and pH doses on treatment efficiency to determine optimal coagulant and flocculant conditions subsequently. The results showed that the three factors considered in this study played an essential role in the removal efficiency of COD, turbidity and oil and grease. The optimal conditions obtained for the coagulant dose, the dose of flocculant, and the pH were 1267, 8.6 mg / L, and 6.4, respectively. Under these optimal conditions, about 90% of COD removal was obtained and 95% to reduce turbidity and oils and fats. The optimal conditions (concentration of coagulant and flocculant, pH) have shown that coagulation-flocculation constitutes an exciting element to evaluate the optimal concentrations for an efficient treatment of wastewater loaded with oils and fats.
- Un UT, Koparal AS, Ogutveren UB (2009) Electrocoagulation of Vegetable Oil Refinery Wastewater Using Aluminum Electrodes. J Env Manag 90(1): 428-433.
- Dermentzis K, Christoforidis A, Valsamidou E (2011) Removal of Nickel, Copper, Zinc and Chromium from Synthetic and Industrial Wastewater by Electrocoagulation. J Environ Sci 1(5): 697-710.
- Hung YT, Kaya D (2020) Treatment of Vegetable Oil Refining Wastes. Evolutionary Progress in Science, Technology, Engineering, Arts, and Mathematics (STEAM) Series. pp: 1-80.
- Pintor AMA, Vilar VJP, Botelho CMS, Boaventura RAR (2016) Oil and Grease Removal from Wastewaters: Sorption Treatment as an Alternative to State-of-the-Art Technologies. Crit Rev Chem Eng J 297: 229-255.
- Jamaly S, Giwa A, Hasan SW (2015) Recent Improvements in Oily Wastewater Treatment: Progress, Challenges, and Future Opportunities. J Environ Sci 37: 15-30.
- Zhang X, Hu Q, Sommerfeld M, Puruhito E, Chen Y (2010) Harvesting Algal Biomass for Biofuels Using Ultrafiltration Membranes. Bioresour Technol 101(14): 5297-5304.
- Cheryan M (2005) Membrane Technology in the Vegetable Oil Industry. Membr Technol 2: 5-7.
- Šereš Z, Maravić N, Takači A, Nikolić I, Šoronja SD, et al. (2016) Treatment of Vegetable Oil Refinery Wastewater Using Alumina Ceramic Membrane: Optimization Using Response Surface Methodology. J Clean Prod 112: 3132-3137.
- El-Gohary F, Tawfik A, Mahmoud U (2010) Comparative Study between Chemical Coagulation/Precipitation (C/P) versus Coagulation/Dissolved Air Flotation (C/DAF) for Pre-Treatment of Personal Care Products (PCPs) Wastewater. Desalination 252(1): 106-112.
- Hanafy M, Nabih HI (2007) Treatment of Oily Wastewater Using Dissolved Air Flotation Technique. Energy Sources A: Recovery Util Environ Eff 29(2): 143-159.
- Louhıchı G, Bousselmı L, Ghrabı A, Khounı I (2019) Process Optimization via Response Surface Methodology in the Physico-Chemical Treatment of Vegetable Oil Refinery Wastewater. Environ Sci Pollut Res 26(19): 18993-19011.
- Rubi H, Fall C, Ortega RE (2009) Pollutant Removal from Oily Wastewater Discharged from Car Washes through Sedimentation-Coagulation. Water Sci Technol 59(12): 2359-2369.
- Nandy T, Shastry S, Pathe PP, Kaul SN (2003) Pre-Treatment of Currency Printing Ink Wastewater through Coagulation-Flocculation Process. Water Air Soil Pollut 148(1-4): 15-30.
- Domínguez JR, Beltrán de HJ, González T, Sanchez LF (2005) Evaluation of Ferric Chloride as a Coagulant for Cork Processing Wastewaters. Influence of the Operating Conditions on the Removal of Organic Matter and Settleability Parameters. Ind Eng Chem Res 44(17): 6539-6548.
- Gürses A, Yalçin M, Dogar C (2003) Removal of Remazol Red RB by Using Al (III) as Coagulant-Flocculant: Effect of Some Variables on Settling Velocity. Water Air Soil Pollut 146(1-4): 297-318.
- Zhu K, Gamal EDM, Moawad AK, Bromley D (2004) Physical and Chemical Processes for Removing Suspended Solids and Phosphorus from Liquid Swine Manure. Environ Technol 25(10): 1177-1187.
- Ennaciri K, Baçaoui A, Sergent M, Yaacoubi A (2014) Application of Fractional Factorial and Doehlert Designs for Optimizing the Preparation of Activated Carbons from Argan Shells. Chemometr Intell Lab 139: 48-57.
- Santos DKS, Silva HS, Ferreira EI, Bruns RE (2005) 32 Factorial Design and Response Surface Analysis Optimization of N-Carboxybutylchitosan Synthesis. Carbohydr Polym 59(1): 37-42.
- Granato D, Ribeiro JCB, Castro IA, Masson ML (2010) Sensory Evaluation and Physicochemical Optimisation of Soy-Based Desserts Using Response Surface Methodology. Food Chem 121(3): 899-906.
- Li H, Xu H, Li S, Feng X, Ouyang P (2012) Optimization of Exopolysaccharide Welan Gum Production by Alcaligenes Sp. CGMCC2428 with Tween-40 Using Response Surface Methodology. Carbohydr Polym 87(2): 1363-1368.
- Singh KP, Gupta S, Singh AK, Sinha S (2010) Experimental Design and Response Surface Modeling for Optimization of Rhodamine B Removal from Water by Magnetic Nanocomposite. Chem Eng J 165(1): 151-160.
- Xue DS, Chen HY, Lin DQ, Guan YX, Yao SJ (2012) Optimization of a Natural Medium for Cellulase by a Marine Aspergillus Niger Using Response Surface Methodology. Appl Biochem Biotechnol 167(7): 1963-1972.
- Coca J, Gutiérrez G (2011) Water Purification and Management. Springer.
- Afnor N (1999) Water Quality-Protocol for the Evaluation of an Alternative Method of Quantitative Physico-Chemical Analysis Compared to a Reference Method; AFNOR, Paris (France). Available online at: https://www.who.int/water_sanitation_health/resourcesquality/waterqualmonitor.pdf
- Mathieu D, Nony J, Phan TLR (2000) New Efficient Methodology for Research Using Optimal Design (NEMRODW) Software, LPRAI, Univ. Aix-Marseille III, France, pp: 22.
- Azbar N, Yonar T (2004) Comparative Evaluation of a Laboratory and Full-Scale Treatment Alternatives for the Vegetable Oil Refining Industry Wastewater (VORW). Process Biochem 39(7): 869-875.
- Dkhissi O, El Hakmaoui A, Souabi S, Chatoui M, Jada A, et al. (2018) Treatment of Vegetable Oil Refinery Wastewater by Coagulation - Flocculation Process Using the Cactus as a Bio - Flo c Culant. J Mater Environ Sci 9(1): 18-25.
- Pandey RA, Sanyal PB, Chattopadhyay N, Kaul SN (2003) Treatment and Reuse of Wastes of a Vegetable Oil Refinery. Res Conser Recycl 37(2): 101-117.
- Chipasa KB (2001) Limits of Physicochemical Treatment of Wastewater in the Vegetable Oil Refining Industry. Pol J Environ Stud 10(3): 141-148.
- Tripathi P, Srivastava VC, Kumar A (2009) Optimization of an Azo Dye Batch Adsorption Parameters Using Box-Behnken Design. Desalination 249(3): 1273-1279.
- Arulmathi P, Elangovan G, Begum AF (2015) Optimization of Electrochemical Treatment Process Conditions for Distillery Effluent Using Response Surface Methodology. Sci World J 2015: 581463.
- Elmoubarki R, Taoufik M, Moufti A, Tounsadi H, Mahjoubi FZ, et al. (2017) Box-Behnken Experimental Design for the Optimization of Methylene Blue Adsorption onto Aleppo Pine Cones. J Mater Environ Sci 8(6): 2184-2191.
- Wang J, Wan W (2009) Factors Influencing Fermentative Hydrogen Production: A Review. Int J Hydrog Energy 34(2): 799-811.
-
 Table 1
 -
Table 2
-
Table 3
-
Table 4
-
Table 5
-
Table 6
-
Table 7
-
Table 8


QUICK LINKS
- SUBMIT MANUSCRIPT
- RECOMMEND THE JOURNAL
-
SUBSCRIBE FOR ALERTS
RELATED JOURNALS
- International Journal of Radiography Imaging & Radiation Therapy (ISSN:2642-0392)
- Journal of Blood Transfusions and Diseases (ISSN:2641-4023)
- International Journal of Diabetes (ISSN: 2644-3031)
- Journal of Rheumatology Research (ISSN:2641-6999)
- Journal of Cancer Science and Treatment (ISSN:2641-7472)
- Advance Research on Alzheimers and Parkinsons Disease
- Journal of Psychiatry and Psychology Research (ISSN:2640-6136)


